

Question: I have answered a, b, c. I really need help knowing how to create the cvp analysis graph on excel. In other words how to
I have answered a, b, c. I really need help knowing how to create the cvp analysis graph on excel. In other words how to plug in the numbers(formulas for every row) on excel to help me create the graph. Please help. I have been stuck on this problem for a while now.

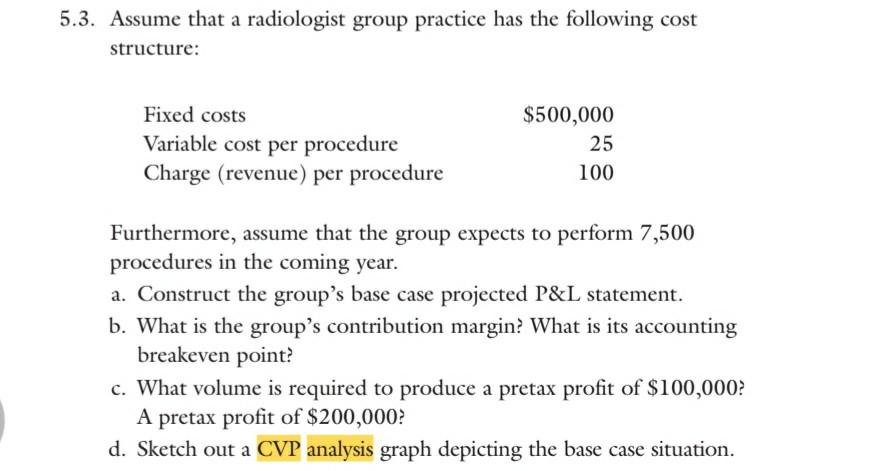
5.3. Assume that a radiologist group practice has the following cost structure: Fixed costs Variable cost per procedure Charge (revenue) per procedure $500,000 25 100 Furthermore, assume that the group expects to perform 7,500 procedures in the coming year. a. Construct the group's base case projected P&L statement. b. What is the group's contribution margin: What is its accounting breakeven point? c. What volume is required to produce a pretax profit of $100,000? A pretax profit of $200,000? d. Sketch out a CVP analysis graph depicting the base case situation. Volume Revenue Fixed Costs Total Costs FI 0 500 1,000 1,500 2,000 2,500 3,000 3,500 4,000 4,500 5,000 5,500 6,000 6,500 7,000 7,500 8,000
Step by Step Solution
There are 3 Steps involved in it

Get step-by-step solutions from verified subject matter experts