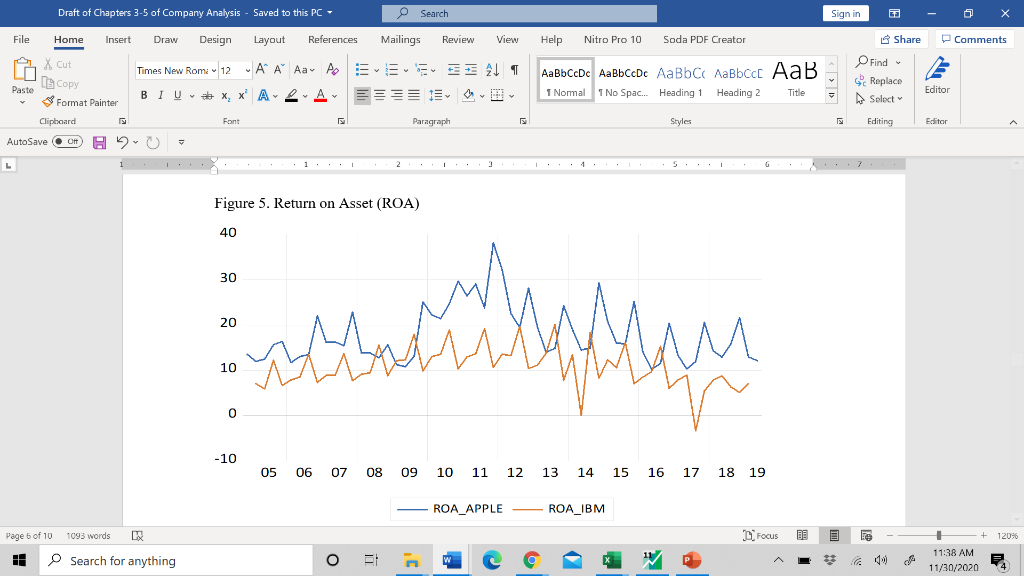
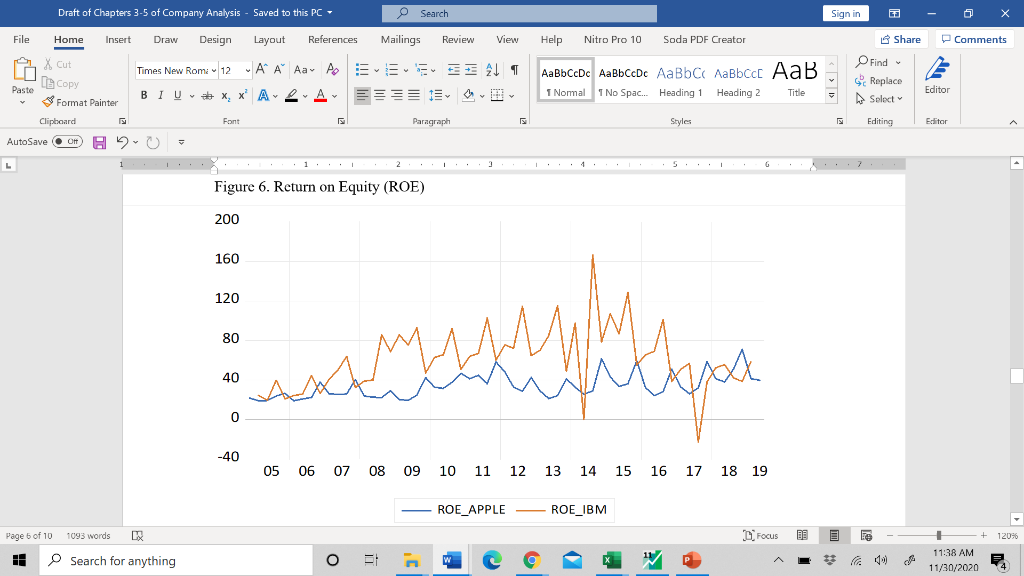
Question: I have attached 2 different graphs below that show the correlation between Apple and IBM. Please interpret the graphs below and provide a comparative analysis
I have attached 2 different graphs below that show the correlation between Apple and IBM. Please interpret the graphs below and provide a comparative analysis for each of the graphs with respect to:
Seasonal Adjustment series that appear show seasonality patterns and placing Seasonal Adjustment.
Long-Term Trend: determine each companys long-term trend (upwards, downwards, or flat).
And Structural Breaks: describe by time period any major structural changes (or breaks - major departures from the long-term trend).
The horizontal axis shows the year from 2005 to 2019.
Draft of Chapters 3-5 of Company Analysis - Saved to this PC- O Search Sign in Ga File Home Insert Draw Design Layout References Mailings Review View Help Nitro Pro 10 Soda PDF Creator Share Comments X Cut s 3 Format Painter AaBbCcDe AaBbCcDc Aabbcc Aabbccc AaB Paste Copy Find Replace Select Times New Roma - 12-A A Aa A ELE ALI BIUX, X A LA 1 Noma I No Spac... Heading 1 Heading 2 Title Editor Clipboard Font Paragraph Styles Editing Editor AutoSave Of 20 1 1 4 5 i G Figure 5. Return on Asset (ROA) 40 30 where that 20 M M 10 0 -10 05 06 07 08 09 10 11 12 13 14 15 16 17 18 19 ROA_APPLE ROA_IBM Page 5 of 10 1093 words Focus BE Ee + 120% 11 Search for anything O BI in w e o W 11:38 AM 11/30/2020 Draft of Chapters 3-5 of Company Analysis - Saved to this PC- O Search Sign in Ga File Home Insert Draw Design Layout References Mailings Review View Help Nitro Pro 10 Soda PDF Creator Share Comments X Cut s 3 Format Painter AaBbCcDe AaBbCcDc Aabbcc Aabbccc AaB Paste Copy Find Replace Select Times New Roma - 12-A A Aa A ELE ALI BIU x x A LA 1 Noma I No Spac... Heading 1 Heading 2 Title Editor V Clipboard Font Paragraph Styles Editing Editor AutoSave Of 20 1 2. 3 4 5 1 G Figure 6. Return on Equity (ROE) 200 160 120 80 An 40 0 -40 05 06 07 08 09 10 11 12 13 14 15 16 17 18 19 ROE_APPLE ROE_IBM Page 5 of 10 1093 words Focus BE Ee + 120% 11 Search for anything o BI LC w c x K . 11:38 AM 11/30/2020 Draft of Chapters 3-5 of Company Analysis - Saved to this PC- O Search Sign in Ga File Home Insert Draw Design Layout References Mailings Review View Help Nitro Pro 10 Soda PDF Creator Share Comments X Cut s 3 Format Painter AaBbCcDe AaBbCcDc Aabbcc Aabbccc AaB Paste Copy Find Replace Select Times New Roma - 12-A A Aa A ELE ALI BIUX, X A LA 1 Noma I No Spac... Heading 1 Heading 2 Title Editor Clipboard Font Paragraph Styles Editing Editor AutoSave Of 20 1 1 4 5 i G Figure 5. Return on Asset (ROA) 40 30 where that 20 M M 10 0 -10 05 06 07 08 09 10 11 12 13 14 15 16 17 18 19 ROA_APPLE ROA_IBM Page 5 of 10 1093 words Focus BE Ee + 120% 11 Search for anything O BI in w e o W 11:38 AM 11/30/2020 Draft of Chapters 3-5 of Company Analysis - Saved to this PC- O Search Sign in Ga File Home Insert Draw Design Layout References Mailings Review View Help Nitro Pro 10 Soda PDF Creator Share Comments X Cut s 3 Format Painter AaBbCcDe AaBbCcDc Aabbcc Aabbccc AaB Paste Copy Find Replace Select Times New Roma - 12-A A Aa A ELE ALI BIU x x A LA 1 Noma I No Spac... Heading 1 Heading 2 Title Editor V Clipboard Font Paragraph Styles Editing Editor AutoSave Of 20 1 2. 3 4 5 1 G Figure 6. Return on Equity (ROE) 200 160 120 80 An 40 0 -40 05 06 07 08 09 10 11 12 13 14 15 16 17 18 19 ROE_APPLE ROE_IBM Page 5 of 10 1093 words Focus BE Ee + 120% 11 Search for anything o BI LC w c x K . 11:38 AM 11/30/2020


