

Question: I HAVE ATTACHED THE LINK FOR TABLE E: https://media.saplinglearning.com/priv/he/stats/psbe5e/tables/psbe5e_tables.pdf A study compared six groups with five observations per group. An F statistic of 3.07 was
I HAVE ATTACHED THE LINK FOR TABLE E:
https://media.saplinglearning.com/priv/he/stats/psbe5e/tables/psbe5e_tables.pdf
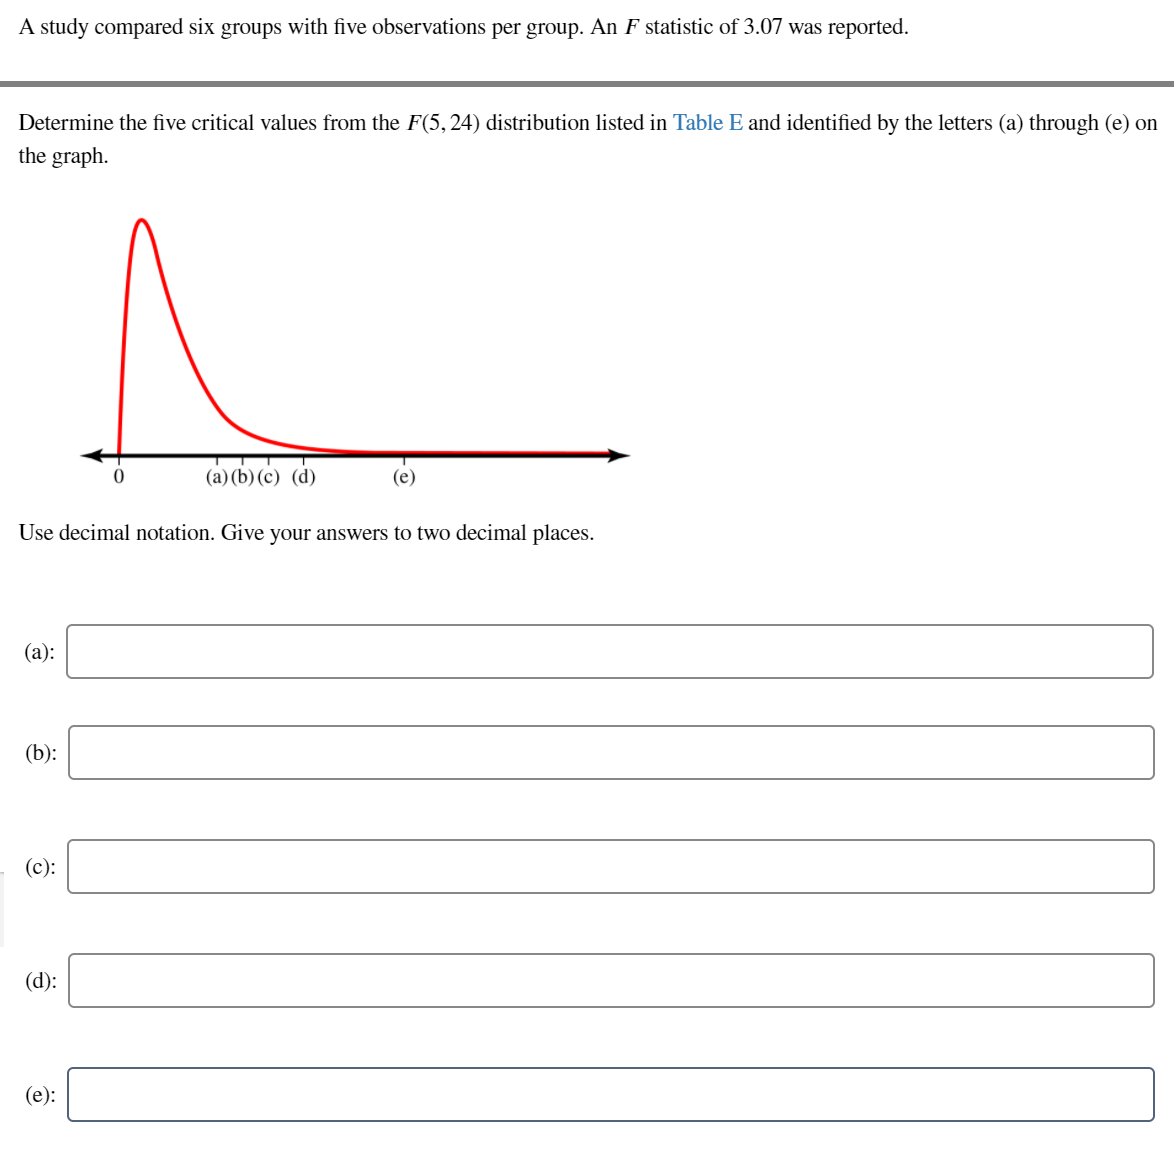
A study compared six groups with five observations per group. An F statistic of 3.07 was reported. the graph. Determine the five critical values from the F(5, 24) distribution listed in Table E and identified by the letters (a) through (e) on (a) (b) (c) (d ) ( e ) Use decimal notation. Give your answers to two decimal places. (a): (b): (c): (d): (e)
Step by Step Solution
There are 3 Steps involved in it
1 Expert Approved Answer
Step: 1 Unlock

Question Has Been Solved by an Expert!
Get step-by-step solutions from verified subject matter experts
Step: 2 Unlock
Step: 3 Unlock