

Question: I have attached the work I submitted and the response from my professor. I am still confused as what I need to correct and why.
I have attached the work I submitted and the response from my professor. I am still confused as what I need to correct and why.
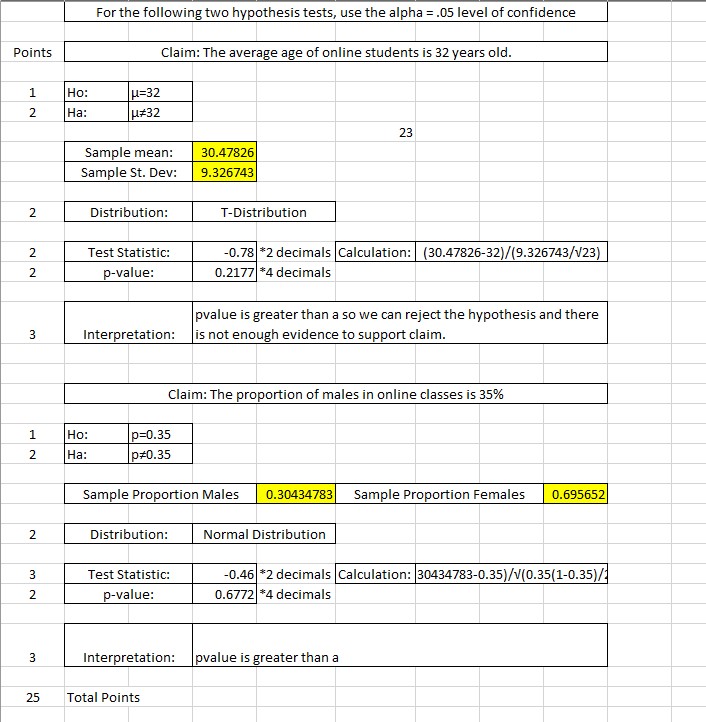
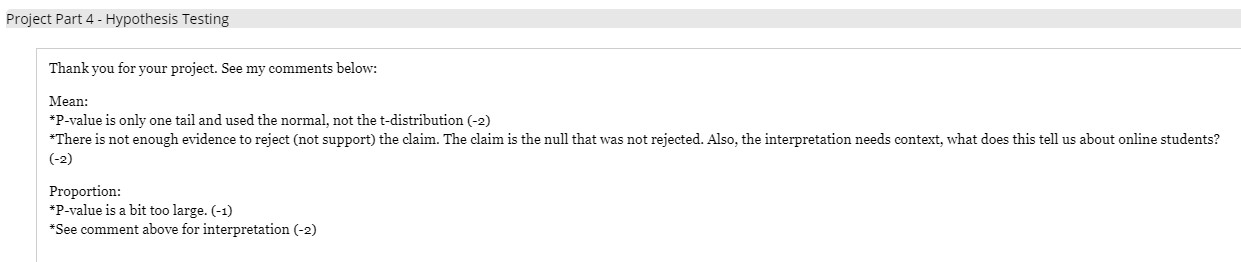
For the following two hypothesis tests, use the alpha = .05 level of confidence Points Claim: The average age of online students is 32 years old. 1 Ho: H=32 Ha: 23 Sample mean: 30.47826 Sample St. Dev: 9.326743 2 Distribution: T-Distribution Test Statistic: 0.78 *2 decimals Calculation: (30.47826-32)/(9.326743/V/23) p-value: 0.2177 #4 decimals pvalue is greater than a so we can reject the hypothesis and there 3 Interpretation: is not enough evidence to support claim. Claim: The proportion of males in online classes is 35% Ho: 0=0.35 N H Ha: 040.35 Sample Proportion Males 0.30434783 Sample Proportion Females |0.695652 2 Distribution: Normal Distribution Test Statistic: 0.46 *2 decimals Calculation: 30434783-0.35)/V(0.35(1-0.35)/ p-value: 0.6772 *4 decimals 3 Interpretation: pvalue is greater than a 25 Total PointsProject Part 4 - Hypothesis Testing Thank you for your project. See my comments below: Mean: *Pivalue is only one tail and used the normal, not the tdistribution [72) *There is not enough evidence to reject [not support) the claim. The claim is the null that was not rejected. Also, the interpretation needs context, what does this tell us about onljne students? (-2) Proportion: *Pvalue is a bit too large. (1) *See comment above for interpretation [*2]
Step by Step Solution
There are 3 Steps involved in it

Get step-by-step solutions from verified subject matter experts