

Question: I have created a scatterplot showing the relationship between age and food purchases and I want to interpret the slope and y-intercept of the regression
I have created a scatterplot showing the relationship between age and food purchases and I want to interpret the slope and y-intercept of the regression equation in the context of my particular problem. I know that the slope tells me how fast y changes with respect to x but I am having a hard time putting that in context with this problem. I also do not know how to interpret the intercept in context with this problem.
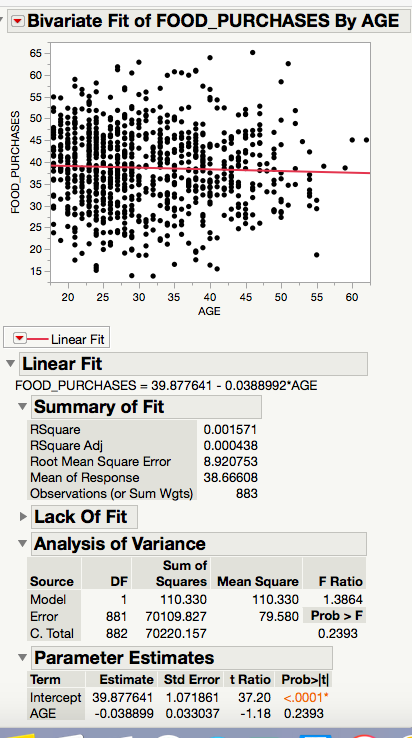
Bivariate Fit of FOOD_PURCHASES By AGE 65 60 55 FOOD PURCHASES 50 45 40 35 30 25 20 15 20 25 30 35 40 45 50 55 60 AGE Linear Fit Linear Fit FOOD_PURCHASES = 39.877641 - 0.0388992*AGE Summary of Fit RSquare 0.001571 RSquare Adj 0.000438 Root Mean Square Error 8.920753 Mean of Response 38.66608 Observations (or Sum Wgts) 883 Lack Of Fit Analysis of Variance Sum of Source DF Squares Mean Square F Ratio Model 1 110.330 110.330 1.3864 Error 881 70109.827 79.580 Prob > F C. Total 882 70220.157 0.2393 Parameter Estimates Term Estimate Std Error t Ratio Probst Intercept 39.877641 1.071861 37.20 <.0001 age>
Step by Step Solution
There are 3 Steps involved in it

Get step-by-step solutions from verified subject matter experts