

Question: I have created the create the scatterplot below in SPSS and plotted the line of best fit (regression line) on the graph. 1. How can
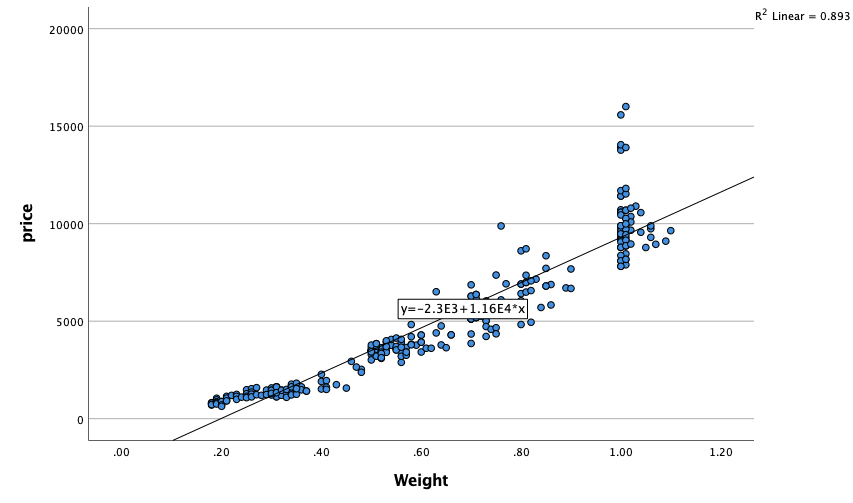
I have created the create the scatterplot below in SPSS and plotted the line of best fit (regression line) on the graph.
1. How can I indicate what the scatterplot indicates regarding the predictability of the dependent variable (price)?

Step by Step Solution
There are 3 Steps involved in it
1 Expert Approved Answer
Step: 1 Unlock

Question Has Been Solved by an Expert!
Get step-by-step solutions from verified subject matter experts
Step: 2 Unlock
Step: 3 Unlock