

Question: i have data below please help me with e and 1, 2 Observation pure water vun Freezing temp of water :0.5 (mean temp value for
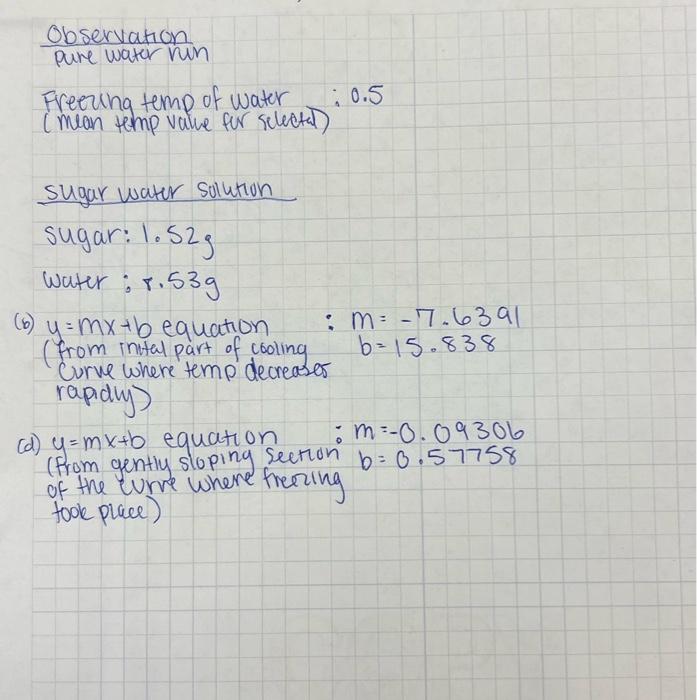
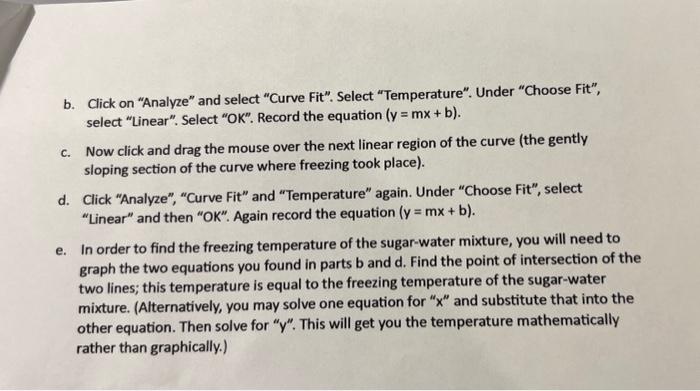
Observation pure water vun Freezing temp of water :0.5 (mean temp value for selecta) sugar water Solution sugar: 1.52g water: 8.53g (b) y=mx+b equation: m=7.6391 (from intal part of cooling b=15.838 curve where temp decreases rapidy) (d) y=mx+b equation m=0.09306 (from gently sloping section b=0.57758 toole place) b. Click on "Analyze" and select "Curve Fit". Select "Temperature". Under "Choose Fit", select "Linear". Select "OK". Record the equation (y=mx+b). c. Now click and drag the mouse over the next linear region of the curve (the gently sloping section of the curve where freezing took place). d. Click "Analyze", "Curve Fit" and "Temperature" again. Under "Choose Fit", select "Linear" and then "OK". Again record the equation (y=mx+b). e. In order to find the freezing temperature of the sugar-water mixture, you will need to graph the two equations you found in parts b and d. Find the point of intersection of the two lines; this temperature is equal to the freezing temperature of the sugar-water mixture. (Alternatively, you may solve one equation for " x " and substitute that into the other equation. Then solve for " y ". This will get you the temperature mathematically rather than graphically.) 13. Print appropriately labeled graphs showing both trials. Data Analysis 1. Using the collected data, calculate the experimental molar mass of sucrose. 2. Calculate the percent error of the experimental molecular weight. Observation pure water vun Freezing temp of water :0.5 (mean temp value for selecta) sugar water Solution sugar: 1.52g water: 8.53g (b) y=mx+b equation: m=7.6391 (from intal part of cooling b=15.838 curve where temp decreases rapidy) (d) y=mx+b equation m=0.09306 (from gently sloping section b=0.57758 toole place) b. Click on "Analyze" and select "Curve Fit". Select "Temperature". Under "Choose Fit", select "Linear". Select "OK". Record the equation (y=mx+b). c. Now click and drag the mouse over the next linear region of the curve (the gently sloping section of the curve where freezing took place). d. Click "Analyze", "Curve Fit" and "Temperature" again. Under "Choose Fit", select "Linear" and then "OK". Again record the equation (y=mx+b). e. In order to find the freezing temperature of the sugar-water mixture, you will need to graph the two equations you found in parts b and d. Find the point of intersection of the two lines; this temperature is equal to the freezing temperature of the sugar-water mixture. (Alternatively, you may solve one equation for " x " and substitute that into the other equation. Then solve for " y ". This will get you the temperature mathematically rather than graphically.) 13. Print appropriately labeled graphs showing both trials. Data Analysis 1. Using the collected data, calculate the experimental molar mass of sucrose. 2. Calculate the percent error of the experimental molecular weight
Step by Step Solution
There are 3 Steps involved in it

Get step-by-step solutions from verified subject matter experts