

Question: I have data from SPSS that describes the relationship between job tenure and turnover intentions as: There is no significant correlation between job tenure and
I have data from SPSS that describes the relationship between job tenure and turnover intentions as: There is no significant correlation between job tenure and the degree to which an individual may leave their position within the company, r(223) = = -.015, p= .82, two-tailed. How would I interpret the following scatterplot given that information?
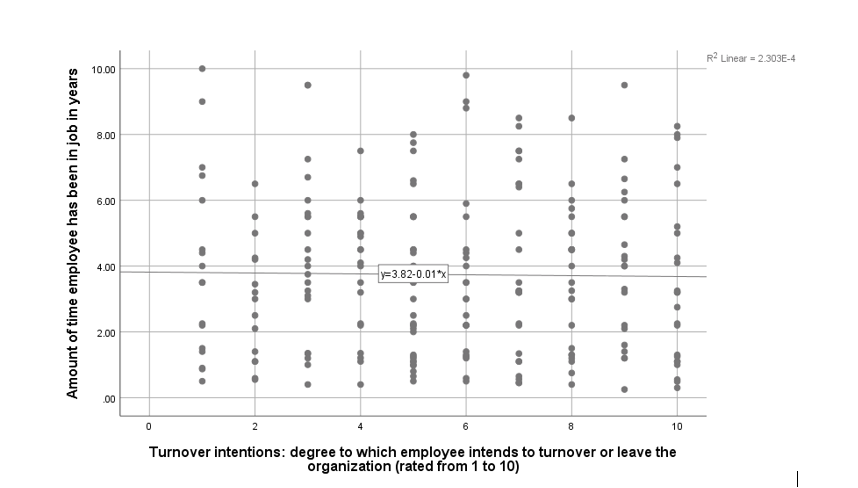
R- Linear = 2.303E-4 10.00 8.00 ... . .. . 6.00 Amount of time employee has been in job in years 4.00 y=3.82-0.01*x 2.00 2 6 8 10 Turnover intentions: degree to which employee intends to turnover or leave the organization (rated from 1 to 10)
Step by Step Solution
There are 3 Steps involved in it
1 Expert Approved Answer
Step: 1 Unlock

Question Has Been Solved by an Expert!
Get step-by-step solutions from verified subject matter experts
Step: 2 Unlock
Step: 3 Unlock