

Question: I have encountered difficulties in solving this problem, and I hope to get help. I have attached the two charts drawn from the data _|
I have encountered difficulties in solving this problem, and I hope to get help. I have attached the two charts drawn from the data
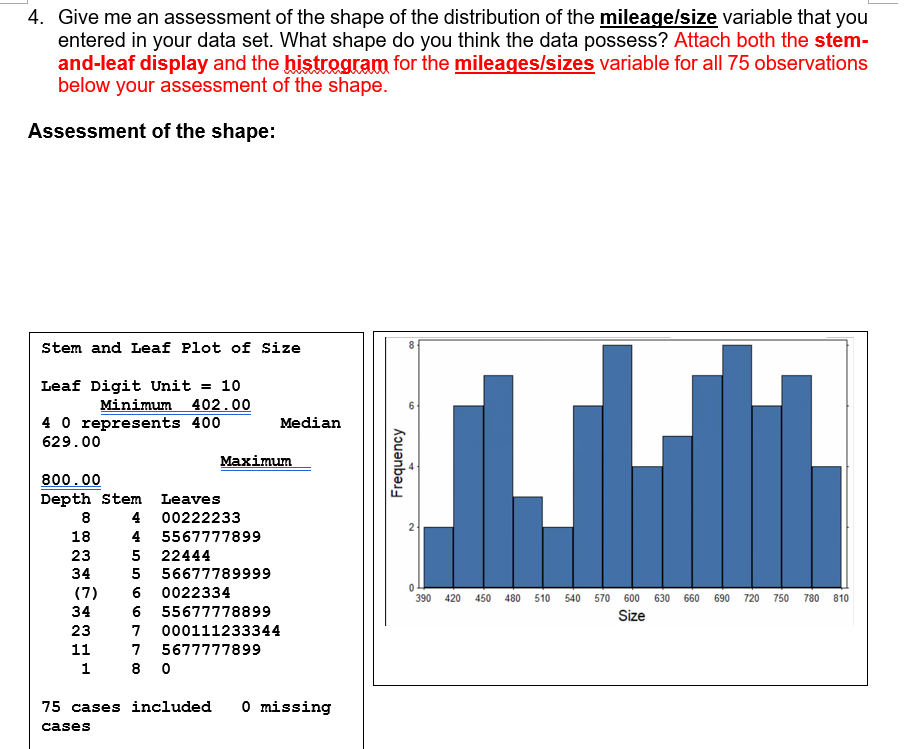
_| | 4. Give me an assessment of the shape of the distribution of the mileagel'size variable that you entered in your data set. What shape do you think the data possess? Attach both the stem- and-leaf display and the m for the mileagesisizes variable for all 75 observations below your assessment of the shape. Assessment of the shape: Stem and Leaf Plot of Size Leaf Digit unit = 10 Minimum 402.00 4 0 represents 400 median 629.00 Maximum 300.00 Depth Stem Leaves 3 4 00222233 13 4 5567777399 23 5 22444 34 5 56677739999 (71' 5 0022334 "m m use m 511: 540 m sun am we 59a 1213 m m m 34 6 55677773399 3E: 23 7 000111233344 11 7 5677777399 1 3 0 75 cases included 0 missing cases
Step by Step Solution
There are 3 Steps involved in it

Get step-by-step solutions from verified subject matter experts