

Question: I have joint two tables, one was for world population and the other for world %poverty. Now, I don't know how adjust it to that
I have joint two tables, one was for world population and the other for world %poverty. Now, I don't know how adjust it to that for each year I should only have one row for each country with %poverty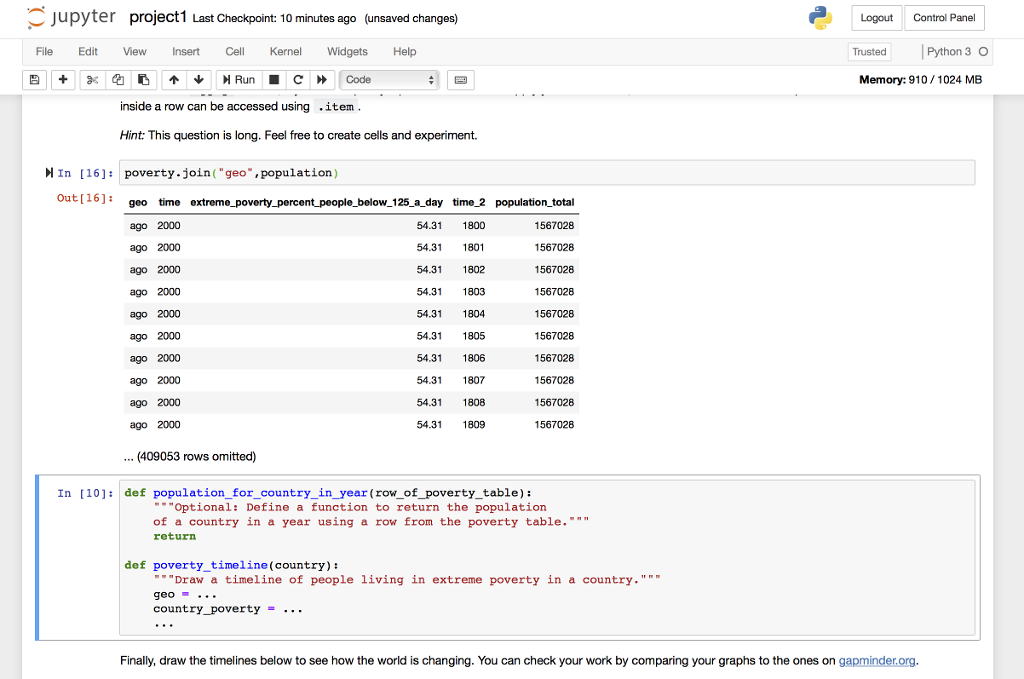
C jupyter project1 Last Checkpoint: 10 minutes ago (unsaved changes) Logout Control Panel TrustedPython 3 O Memory: 910/1024 MB File Edit View Insert Cell Kernel Widgets Help inside a row can be accessed using .item Hint: This question is long. Feel free to create cells and experiment. In [16]: poverty-join("geo,population) geo time extreme_poverty percent people_below 125 a day time 2 population total ago 2000 ago 2000 ago 2000 ago 2000 ago 2000 ago 2000 ago 2000 ago 2000 ago 2000 ago 2000 54.311800 54.31 1801 54.31 1802 54.31 1803 54.31 1804 54.31 1805 54.31 1806 54.31 1807 54.31 1808 54.31 1809 1567028 1567028 1567028 1567028 1567028 1567028 1567028 1567028 1567028 1567028 (409053 rows omitted) In [101 def population_for_country_in_year (row_of_poverty_table): "Optional: Define a function to return the population of a country in a year using a row from the poverty table.""" return def poverty timeline (country): Draw a timeline of people living in extreme poverty in a country."" geo .. country_poverty - . .. Finally, draw the timelines below to see how the world is changing. You can check your work by comparing your graphs to the ones on gapminder.org. C jupyter project1 Last Checkpoint: 10 minutes ago (unsaved changes) Logout Control Panel TrustedPython 3 O Memory: 910/1024 MB File Edit View Insert Cell Kernel Widgets Help inside a row can be accessed using .item Hint: This question is long. Feel free to create cells and experiment. In [16]: poverty-join("geo,population) geo time extreme_poverty percent people_below 125 a day time 2 population total ago 2000 ago 2000 ago 2000 ago 2000 ago 2000 ago 2000 ago 2000 ago 2000 ago 2000 ago 2000 54.311800 54.31 1801 54.31 1802 54.31 1803 54.31 1804 54.31 1805 54.31 1806 54.31 1807 54.31 1808 54.31 1809 1567028 1567028 1567028 1567028 1567028 1567028 1567028 1567028 1567028 1567028 (409053 rows omitted) In [101 def population_for_country_in_year (row_of_poverty_table): "Optional: Define a function to return the population of a country in a year using a row from the poverty table.""" return def poverty timeline (country): Draw a timeline of people living in extreme poverty in a country."" geo .. country_poverty - . .. Finally, draw the timelines below to see how the world is changing. You can check your work by comparing your graphs to the ones on gapminder.org
Step by Step Solution
There are 3 Steps involved in it

Get step-by-step solutions from verified subject matter experts