

Question: I have loaded a shapefile into r studio and used the plot function to plot the polygons representing different counties. When I go to label
I have loaded a shapefile into r studio and used the plot function to plot the polygons representing different counties.
When I go to label the polygons with ordered numbers 1-28, the label appear but they are stacked in certain areas.
Is there anything I can do to so the number labels aren't stacked?
I've included a copy of my code and screenshot of my plot below.
#Label Featuresas.data.frame(p)p$value 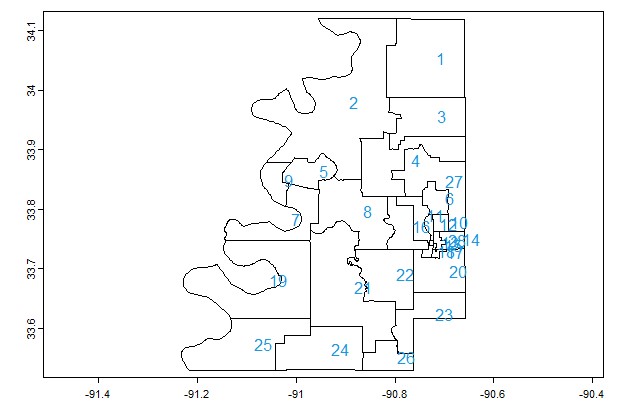
Step by Step Solution
There are 3 Steps involved in it
1 Expert Approved Answer
Step: 1 Unlock

Question Has Been Solved by an Expert!
Get step-by-step solutions from verified subject matter experts
Step: 2 Unlock
Step: 3 Unlock