

Question: I have seven variables below. I've written a code in R to plot all seven variables in the air pollution data using, say, Rainfall and
I have seven variables below. I've written a code in R to plot all seven variables in
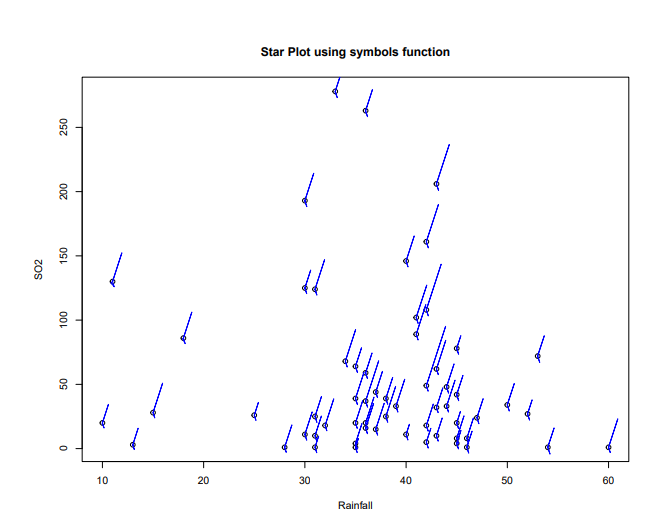
the air pollution data using, say, Rainfall and S02 to form the basic scatterplot.
Here is my code, including the data frame. I also included two images of the "star" plots I generated. They look different, and I'm unsure if either is correct for a star plot.
author: "Bill desRosiers"date: "`r Sys.Date()`"output: pdf_document: default html_document: default---```{r setup, include=FALSE}knitr::opts_chunk$set(echo = TRUE, fig.width = 10, fig.height = 8)``````{r}#loading packgages necessary to complete the assignment. library(lattice)library(plotly)```The first thing I did for this week's assignment is copy and paste the text in the data file into the code chunk below. Given the data was already formated for R this was an easy way ti import the data and create a data frame called airpoll. ```{r}"airpoll" 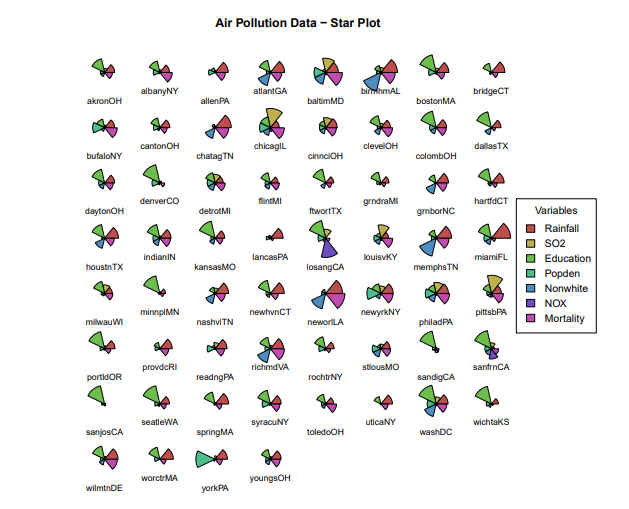
Step by Step Solution
There are 3 Steps involved in it
1 Expert Approved Answer
Step: 1 Unlock

Question Has Been Solved by an Expert!
Get step-by-step solutions from verified subject matter experts
Step: 2 Unlock
Step: 3 Unlock