

Question: I have some question here, Note: Ifyour answer does not exactly match the correct choice, it is due to rounding ofintermediate calculations. To avoid the


I have some question here,


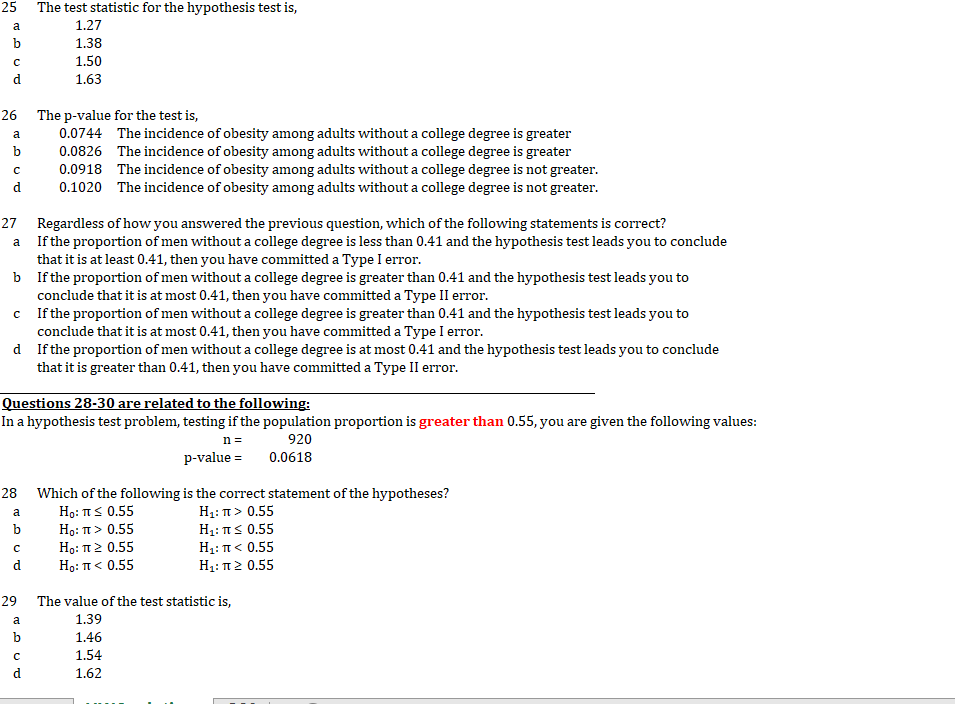
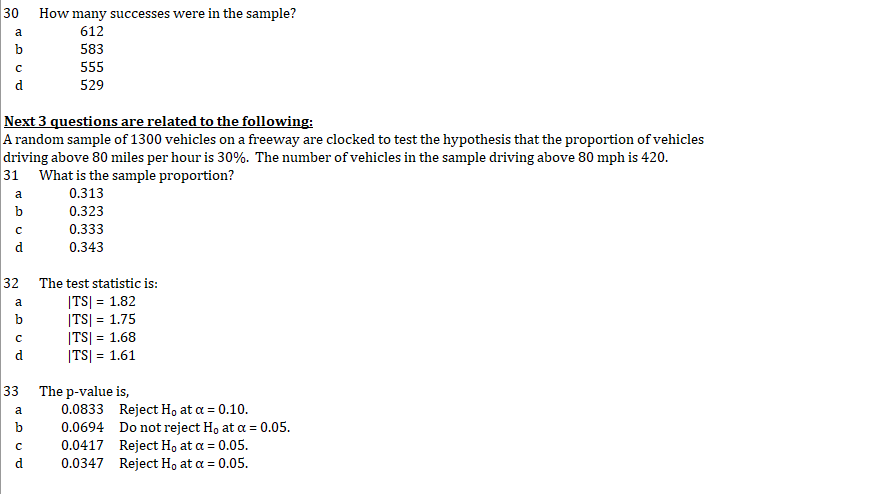

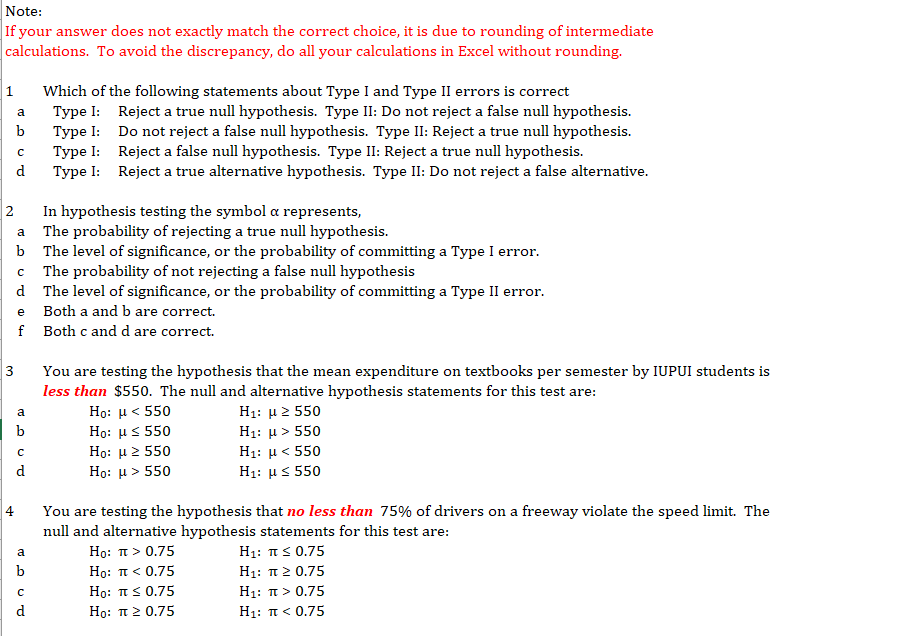
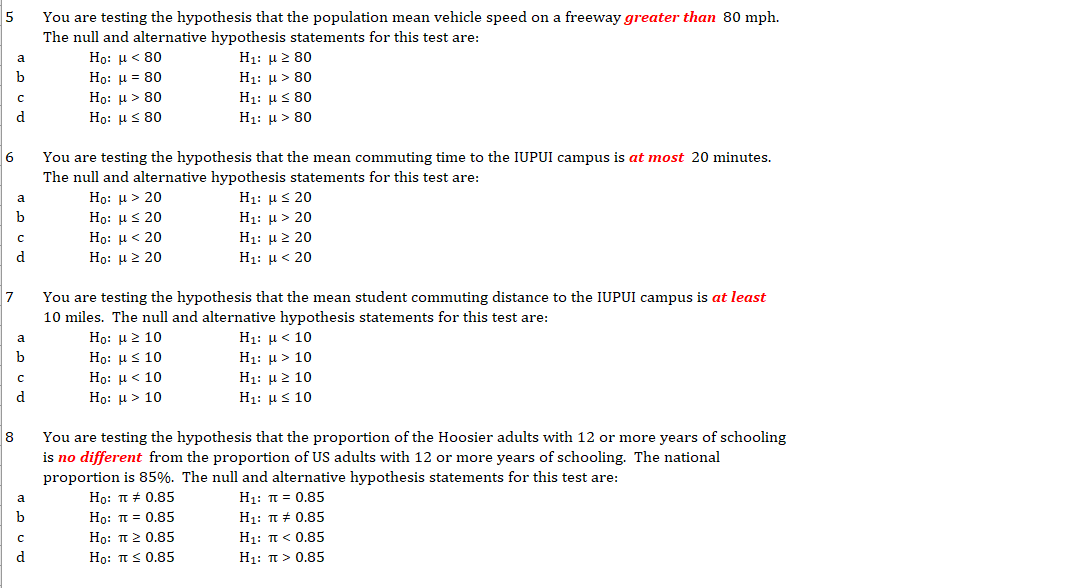
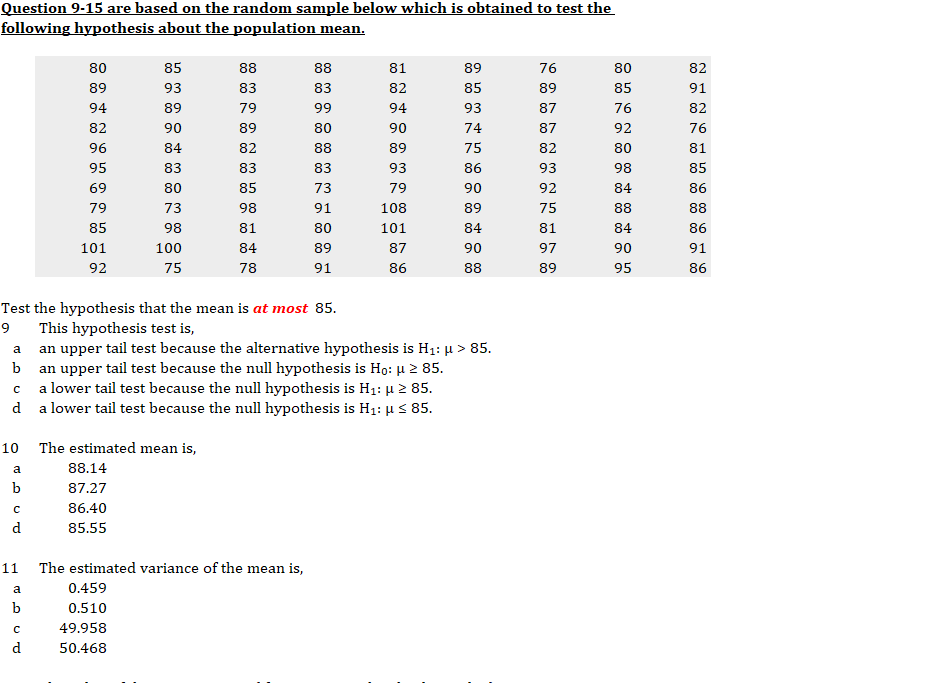
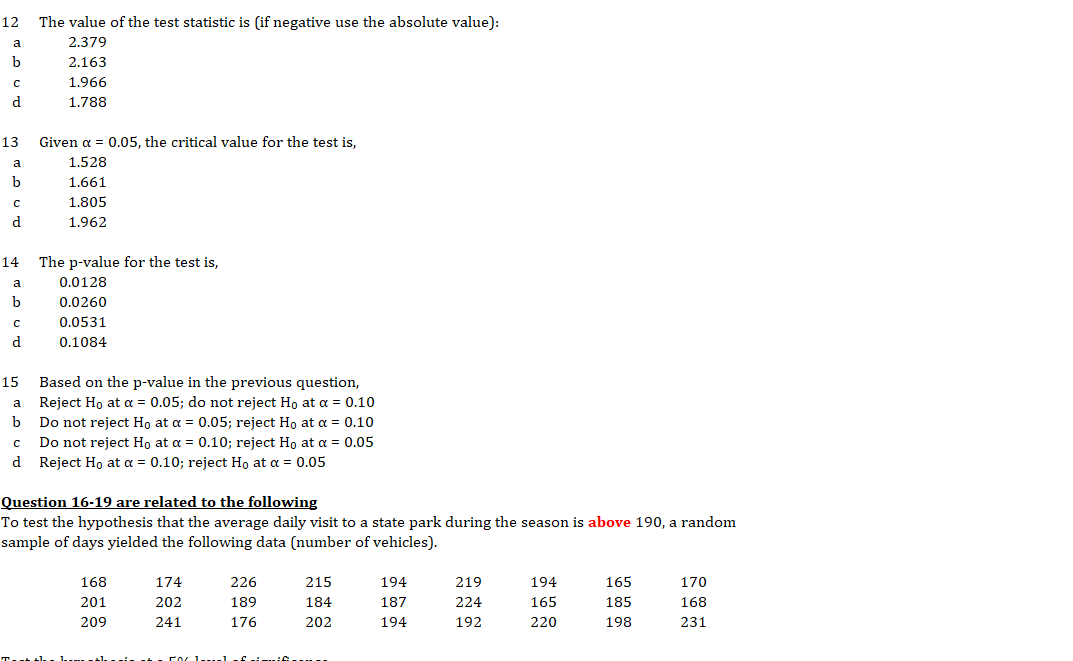
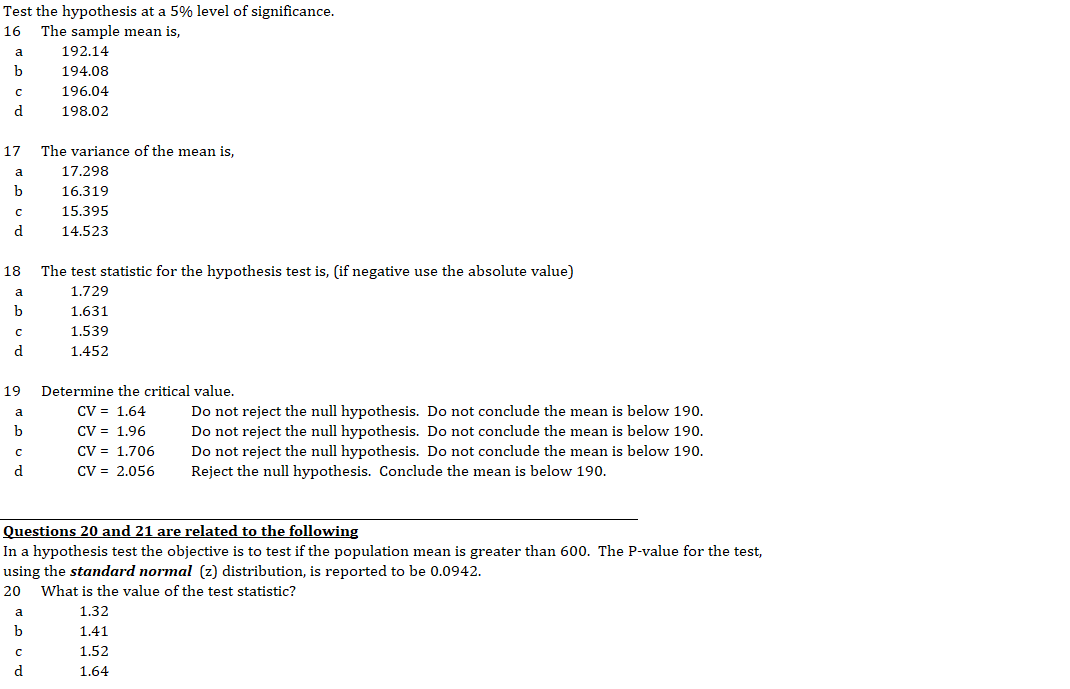
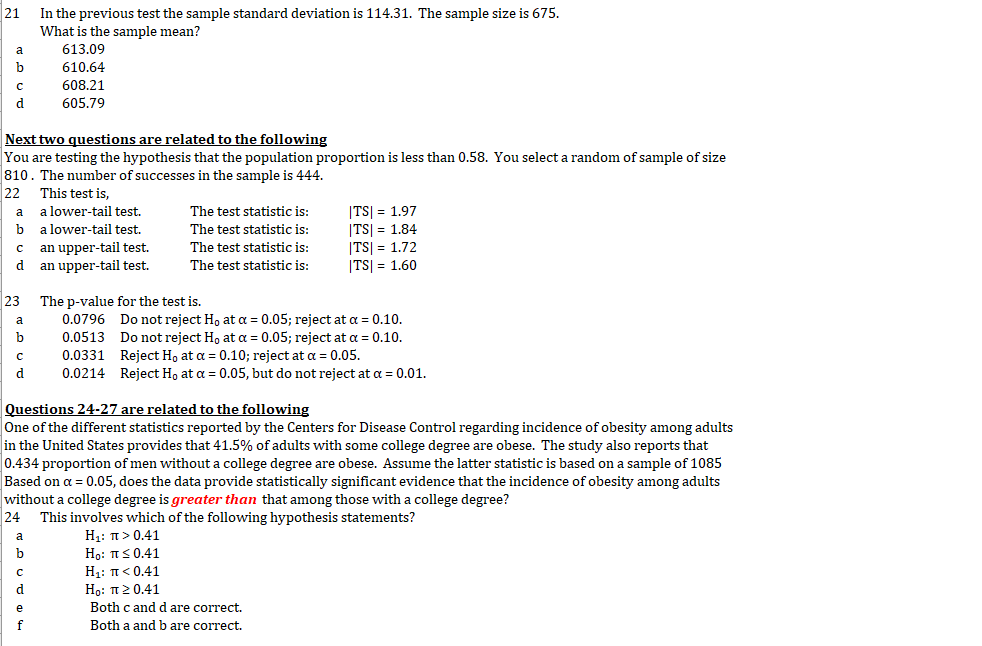
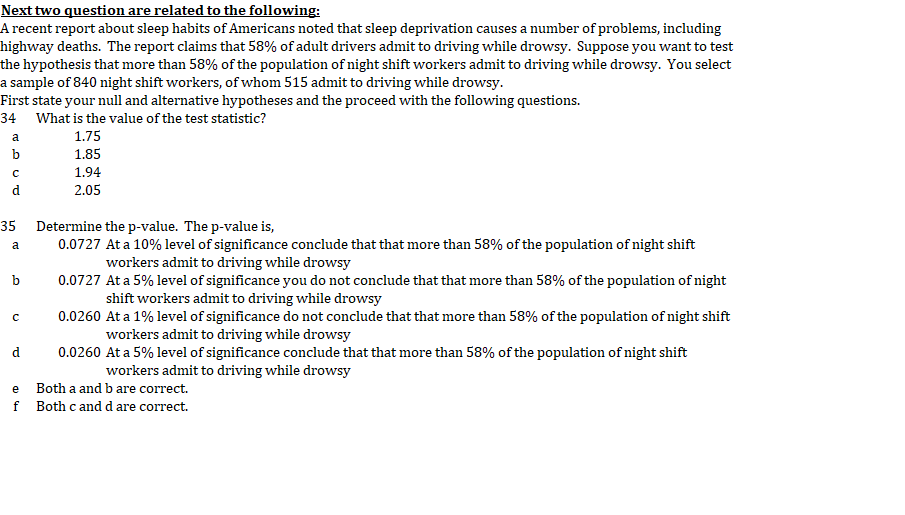
Note: Ifyour answer does not exactly match the correct choice, it is due to rounding ofintermediate calculations. To avoid the discrepancy, do all your calculations in Excel without rounding. 1 'Which ofthe following statements about Type I and Type II errors is correct Type I: Reject a true null hypothesis. Type 11: Do not reject a false null hypothesis. Type I: Do not reject a false null hypothesis. Type II: Reject a true null hypothesis. Type I: Reject a false null hypothesis. Type II: Reject a true null hypothesis. Type I: Reject a true alternative hypothesis. Type 11: Do not reject a false alternative. nnn'm 2 In hypothesis testing the symbol a: represents, The probability of rejecting a true null hypothesis. The level of signicance, or the probability of committing a Type I error. The probability of not rejecting a false null hypothesis The level of signicance, or the probability of committing a Type 11 error. Both a and b are correct. Both c and d are correct. mmgno'm 3 You are testing the hypothesis that the mean expenditure on textbooks per semester by IUPUI students is less than $550. The null and alternative hypothesis statements for this test are: a no: u 550 c "o: u 1: 550 __1: [,1 30 Ho: \":30 H1: [.1530 H0: pSBU H1: \">30 You are testing the hypothesis that the mean commuting time to the IUPUI campus is at most 20 minutes. The null and alternative hypothesis statements for this test are: Ho: [1320 H1: [.1520 Ho: [1320 H1: \":20 Ho: \"10 Ho:p10 H1: [.1510 You are testing the hypothesis that the proportion ofthe Hoosier adults with 12 or more years of schooling is no dlerent from the proportion of US adults with 12 or more years of schooling. The national proportion is 35%. The null and alternative hypothesis statements for this test are: Ho: TE 5* 0.35 H1: T: = 0.35 Ho: 1': = 0.35 H1: 1': 5'5 0.35 Ho: TE 32 0.35 H1: 1': 0.85 Question 9-15 are based on the random sample below which is obtained to test the following hypothesis about the population mean. 30 35 33 33 31 39 39 93 33 33 32 35 94 39 79 99 94 93 32 90 39 30 90 74 96 34 32 33 39 75 95 33 33 33 93 36 69 30 35 73 79 90 79 73 93 91 103 39 35 93 31 30 101 34 101 100 34 39 37 90 92 75 73 91 36 33 Test the hypothesis that the mean is at most 35. 9 This hypothesis testis, an upper tailtest because the null hypothesis is Ho: [.1 2 35. a lower tailtest because the null hypothesis is 1-1141 2 35. a lower tailtesthecause the null hypothesis is H141 S 35. -nu'm 10 The estimated mean is, a 3344 h 3727 c 3640 d 3555 1 The estimated variance of the mean is, a 0459 b 0510 c 49353 d 50463 an upper tailtest because the alternative hypothesis is H141 > 35. 76 39 37 37 32 93 92 75 31 97 39 30 35 76 92 30 93 34 33 34 90 95 32 91 32 76 31 35 36 33 36 91 36 12 The value ofthe test statistic is [if negative use the absolute value]: a 2.3?9 b 2.163 c 1.966 d 1.?33 13 Given a = 0.05, the critical value for the testis, a 1.523 b 1.661 c 1.305 d 1.962 14- T'he p-value for the test is, a 0.0123 in 0.0260 c 0.0531 d 0.1034- 15 Based on the p-value in the previous question, Reject H0 at a = 0.05; do not reject H0 at a = 0.10 Do not reject H0 at a = 0.05: reject H0 at a = 0.10 Do not reject H0 at a = 0.10: reject H0 at a = 0.05 Reject H0 at a = 0.10: reject H0 at d = 0.05 -nD'nJ Question 16-19 are related to the following To test the hypothesis that the average daily visit to a state park during the season is above 190, a random sample of days yielded the following data [number ofvehicles]. 163 1?4 226 215 194- 219 194- 165 1?0 201 202 139 134- 137 224- 165 135 163 209 24-1 1?6 202 194- 192 220 193 231 rr-__..;I__ I_____..I___=_ _.. _ r'rn 'l____l _r _:__=c__.___ Test the hypothesis at a 5% level of signicance. 16 The sample mean is, a 192.14 b 194.08 c 196.04 d 198.02 1? The variance ofthe mean is, a 1?.298 b 16.319 c 15.395 d 14.523 18 The test statistic for the hypothesis test is, [if negative use the absolute value] a 1.?29 b 1.631 c 1.539 d 1.452 19 Determine the critical value. CV = 1.64 Do not reject the null hypothesis. Do not conclude the mean is below 190. CV = 1.96 Do not reject the null hypothesis. Do not conclude the mean is below 190. CV = 1.?06 Do not reject the null hypothesis. Do not conclude the mean is below 190. CV = 2.056 Reject the null hypothesis. Conclude the mean is below 190. ano'm Questions 20 and 21 are related to the following In a hypothesis test the objective is to test if the population mean is greater than 600. The P-value for the test, using the standard normal (2] distribution, is reported to be 0.0942. 20 What is the value of the test statistic? a 1.32 b 1.41 c 1.52 d 1.64 21 a b c d In the previous test the sample standard deviation is 114.31. The sample size is 675. What is the sample mean? 61 3 .0 9 61 0 .64 60 8.2 1 60 5 .? 9 Next two questions are related to the following You are testing the hypothesis that the population proportion is less than 0.5 B. You select a random of sample of size 810 . 22 a not? 23 a b c d The number of successes in the sample is 444. This test is, a lowertail test. The test statistic is: |TS| = 1.9? a lowertail test. The test statistic is: |TS| = 1.84 an upper-tail test. The test statistic is: |TS| = 1.?2 an uppertail test. The test statistic is: |TS| = 1.60 The pvalue for the test is. 0.0?96 Donotreject HE ata=0.05;reiectato:=0.10. 0.0513 Donotreject Hg atoc=0.05;reiectatoc=0.10. 0.0331 RejectHnatu=0.10;rejectata=0.05. 0.0214 Reject Hg at a = 0.05,but donot rejectat d = 0.01. Questions 24-27 are related to the following One of the different statistics reported by the Centers for Disease Control regarding incidence of obesity among adults in the United States provides that 41.5% of adults with some college degree are obese. The study also reports that 0.434 proportion of men without a college degree are obese. Assume the latter statistic is based on a sample of 1085 Based on {x = 0.05, does the data provide statistically signicant evidence that the incidence of obesity among adults without a college degree is greater than that among those with a college degree? 24 This involves which of the following hypothesis statements? magnum H1: 11 > 0.41 Hg: 11 S 0.41 H1: 11: c 0.41 Hg: TI: 2 0.41 Both c and d are correct. Bothaand bare correct. 25 The test statistic for the hypothesis test is, a 1.2:" b 1.38 c 1.50 d 1.63 26 The p-value for the test is, 0.0 744 The incidence of obesity among adults without a college degree is greater 0.0826 The incidence of obesity among adults without a college degree is greater 0.0918 The incidence of obesity among adults without a college degree is not greater. 0.1020 The incidence of obesity among adults without a college degree is not greater. Qu'm 27' Regardless of how you answered the previous question, which of the following statements is correct? a If the proportion of men without a college degree is less than 0.41 and the hypothesis test leads you to conclude that it is at least 0.41, then you have committed a Type I error. b If the proportion of men without a college degree is greater than 0.41 and the hypothesis test leads you to conclude that it is at most 0.41, then you have committed a Type 11 error. c If the proportion of men without a college degree is greater than 0.41 and the hypothesis test leads you to conclude that it is at most 0.41, then you have committed a Type I error. :1 If the proportion of men without a college degree is at most 0.41 and the hypothesis test leads you to conclude that it is greater than 0.41, then you have committed a Type ll error. Questions Zl-B are related to the following; In a hypothesis test problem, testing if the population proportion is greater than 0.55, you are given the following values: 11 = 920 pvalue = 0.0618 23 Which of the following is the correct statement of the hypotheses? a Hu:1'I:E 0.55 Hint} 0.55 b Hull-[3' 0.55 Hill-[E 0.55 E: Hunt? 0.55 Hint-C 0.55 d Hull-[C 0.55 Hill-[2 0.55 29 The value of the test statistic is, a 1.39 b 1.4-6 c 1.54 d 1.62 ______ . _. | ___ . _ 30 How many successes were in the sample? a 612 b 583 c 555 d 529 Next 3 questions are related to the following; A random sample of 1300 vehicles on a freeway are clocked to test the hypothesis that the proportion of vehicles driving above 80 miles per hour is 30%. The number of vehicles in the sample driving above 80 mph is 4-20. 31 What is the sample proportion? a 0.313 b 0.323 c 0.333 d 0.343 32 The test statistic is: a |TS| = 1.32 b |TS| = 1.35 c |TS| = 1.53 d |TS| = 1.51 33 The p-value is, a 0.0833 Reject HE ata=0.10. b 0.0694- Donotreject HE atlx=0.05. c 0.041? Reject HE atlx=0.05. d 0.034? Reject HE ata=0.05. Next two question are related to the following; A recent report about sleep habits of Americans noted that sleep deprivation causes a number of problems, including highway deaths. The report claims that 58% of adult drivers admit to driving while drowsy. Suppose you want to test the hypothesis that more than 58% of the population of night shift workers admit to driving while drowsy. You select a sample of 84-0 night shift workers, of whom 515 admit to driving while drowsy. First state your null and alternative hypotheses and the proceed with the following questions. 34- 'W'hat is the value ofthe test statistic? a 1.?5 b 1.85 c 1.94- d 2.05 35 Determine the p-value. The p-value is, a 0.0?2? At a 10% level of signicance conclude that that more than 58% ofthe population ofnight shift workers admit to driving while drowsy b 0.0?2? At a 5% level of signicance you do not conclude that that more than 58% ofthe population of night shift workers admit to driving while drowsy c 0.0260 At a 1% level of signicance do not conclude that that more than 58% of the population of night shift workers admit to driving while drowsy d 0.0260 At a 5% level of signicance conclude that that more than 58% ofthe population ofnight shift workers admit to driving while drowsy e Both a and b are correct. f Both c and d are correct
Step by Step Solution
There are 3 Steps involved in it

Get step-by-step solutions from verified subject matter experts