

Question: I have this math problem that I need help with. Please let me know. L4.) Best Value Properties specializes in custom-home re-sales in Silver Lake,
I have this math problem that I need help with. Please let me know.
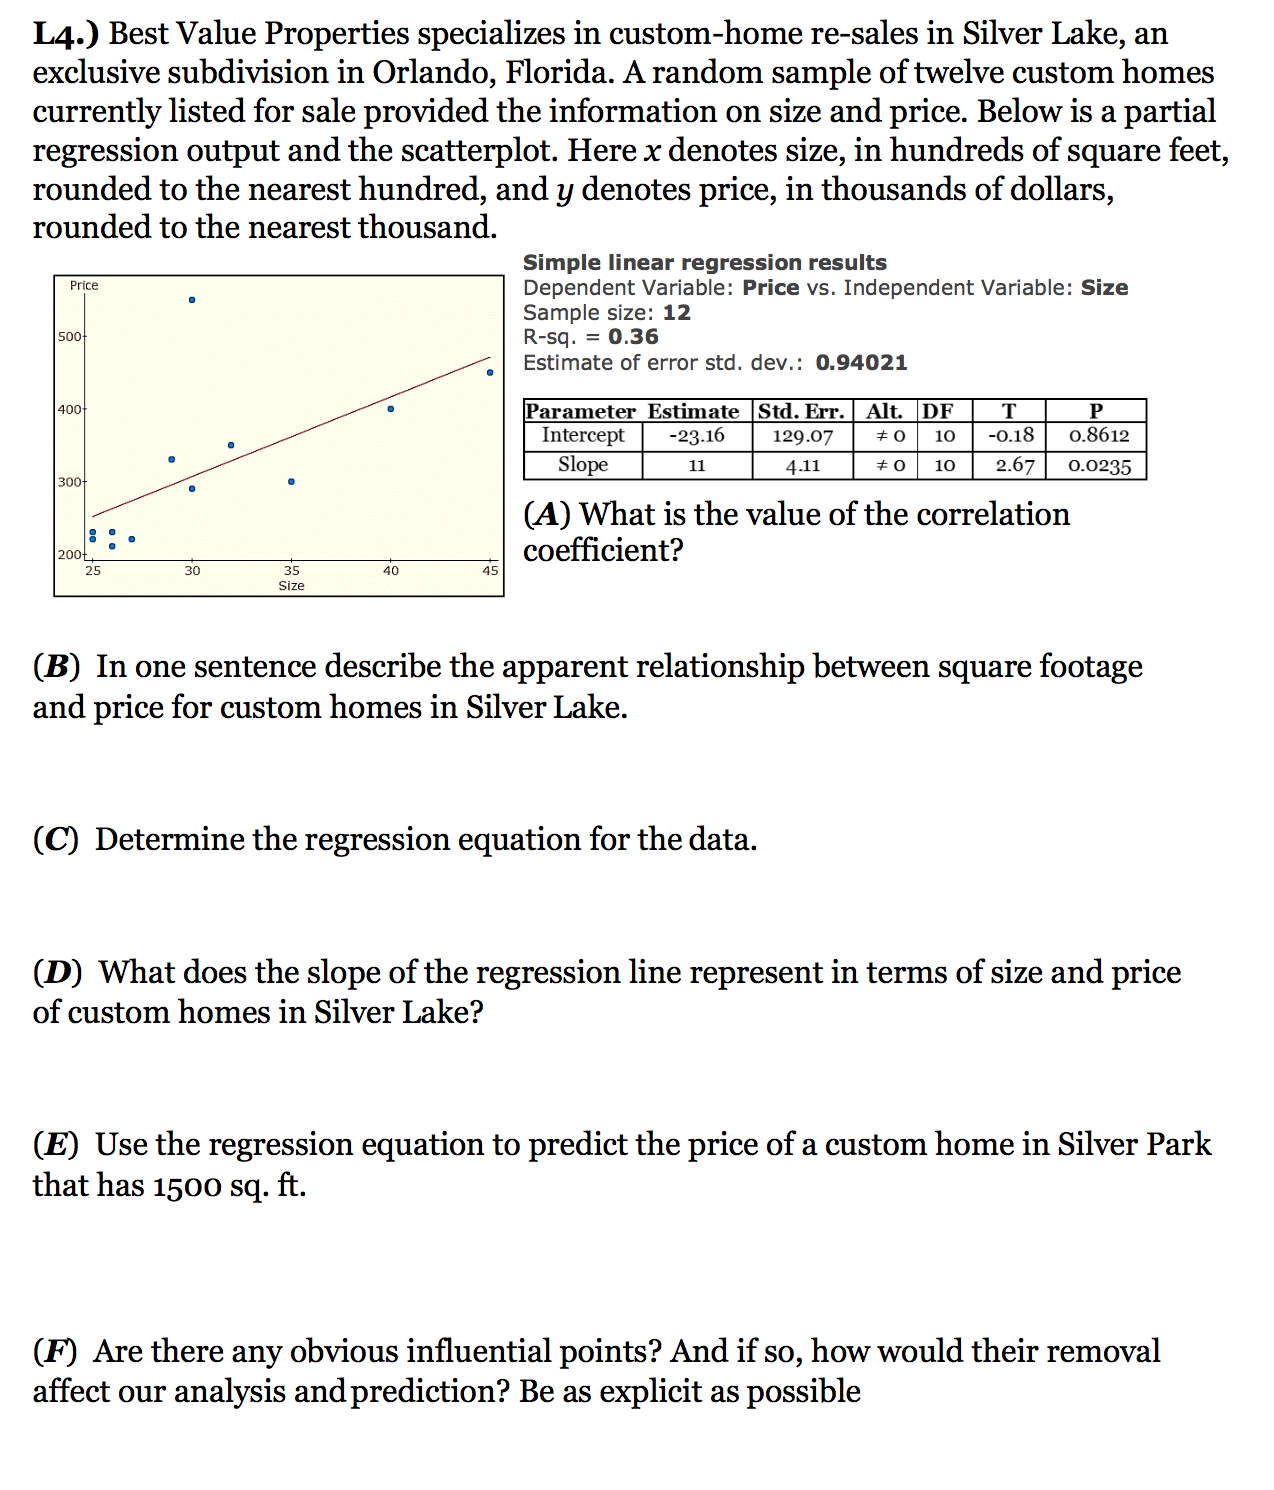
L4.) Best Value Properties specializes in custom-home re-sales in Silver Lake, an exclusive subdivision in Orlando, Florida. A random sample of twelve custom homes currently listed for sale provided the information on size and price. Below is a partial regression output and the scatterplot. Here x denotes size, in hundreds of square feet, rounded to the nearest hundred, and y denotes price, in thousands of dollars, rounded to the nearest thousand. Simple linear regression results Dependent Variable: Price vs. Independent Variable: Size Sample size: 12 Rsq. = 0.36 Estimate of error std. dev.: 0.94021 I-MEEEI-I mm-u mam\"m: (A) What is the value of the correlation coefcient? (B) In one sentence describe the apparent relationship between square footage and price for custom homes in Silver Lake. (C) Determine the regression equation for the data. (D) What does the slope of the regression line represent in terms of size and price of custom homes in Silver Lake? (E) Use the regression equation to predict the price of a custom home in Silver Park that has 1500 sq. ft. (F) Are there any obvious inuential points? And if so, how would their removal affect our analysis and prediction? Be as explicit as possible
Step by Step Solution
There are 3 Steps involved in it

Get step-by-step solutions from verified subject matter experts