

Question: I have this matlab code to make an ellipse and a circle, but i cant get them on the same graph. Run Section Breakpoints Run
I have this matlab code to make an ellipse and a circle, but i cant get them on the same graph. 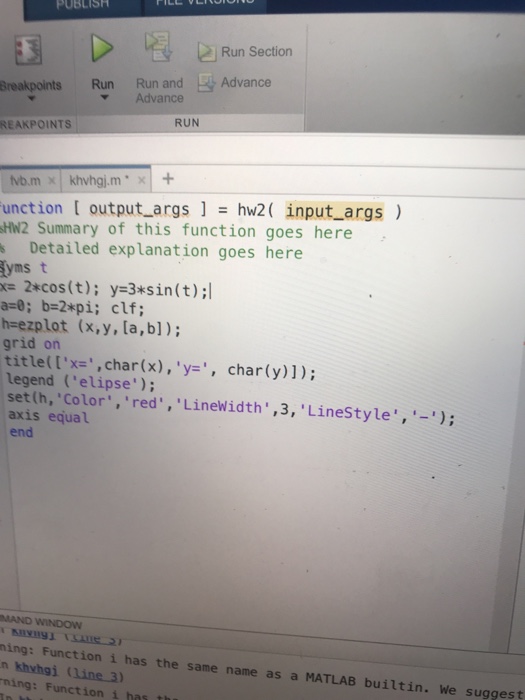
Run Section Breakpoints Run Run andAdvance RUN REAKPOINTS unction [ output_args ] = hW2 ( nput-args ) HN2 Summary of this function goes here s Detailed explanation goes here yms t x 2+cos(t); y-3*sin(t)1 gee; b=2*pi; clf; h-ezplot (x,y, [a,bl); grid on titlell'xz.,char(x),\p", charly)]); legend ('elipse) set (h, 'Color','red, LineWidth',3, 'LineStyle, axis equaL end MAND WINDOW ning: Function has the same name as a MATLAB builtin. We suggest n khyhgi (Line 3) ning: Function i has th
Step by Step Solution
There are 3 Steps involved in it
1 Expert Approved Answer
Step: 1 Unlock

Question Has Been Solved by an Expert!
Get step-by-step solutions from verified subject matter experts
Step: 2 Unlock
Step: 3 Unlock