

Question: I have this state space callculation result in the control course.I want you to write a matlab code that will plot the graph i draw
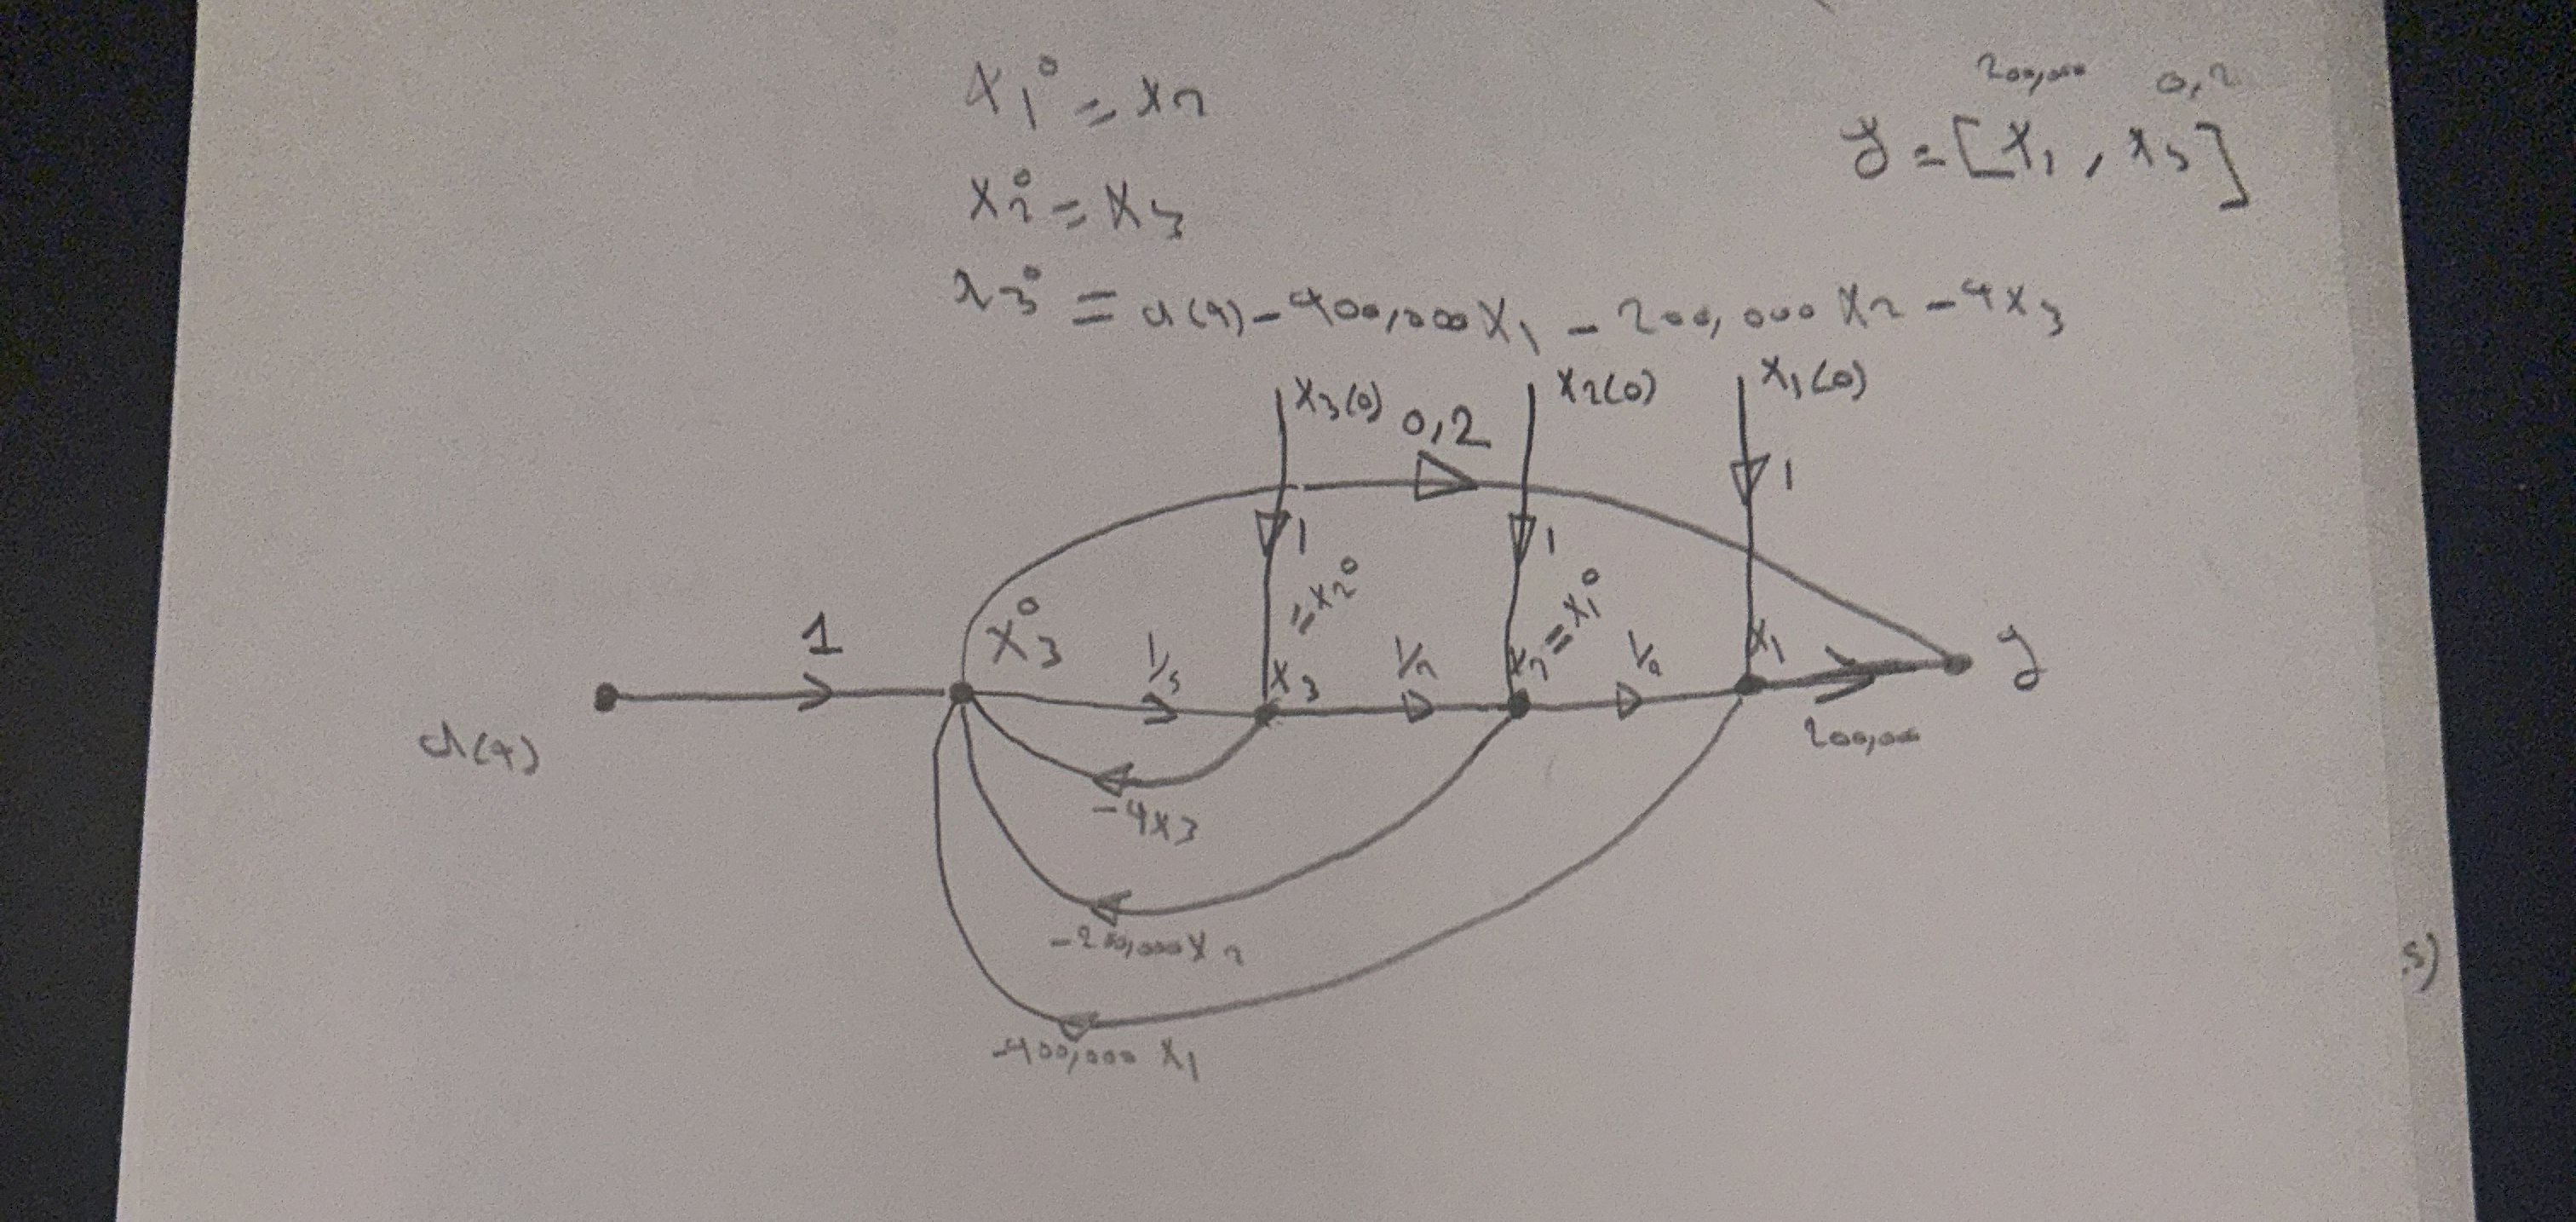
I have this state space callculation result in the control course.I want you to write a matlab code that will plot the graph i draw it here manully but i want it by matlab alsi so do it please and send the code here.the plot from matlab should look like my draw
Whre and
Step by Step Solution
There are 3 Steps involved in it
1 Expert Approved Answer
Step: 1 Unlock

Question Has Been Solved by an Expert!
Get step-by-step solutions from verified subject matter experts
Step: 2 Unlock
Step: 3 Unlock