

Question: I have to graph Table 2: Speed vs. Time Data Distance from Time through Time through Time from Speed A to B photogate A photogate
I have to graph
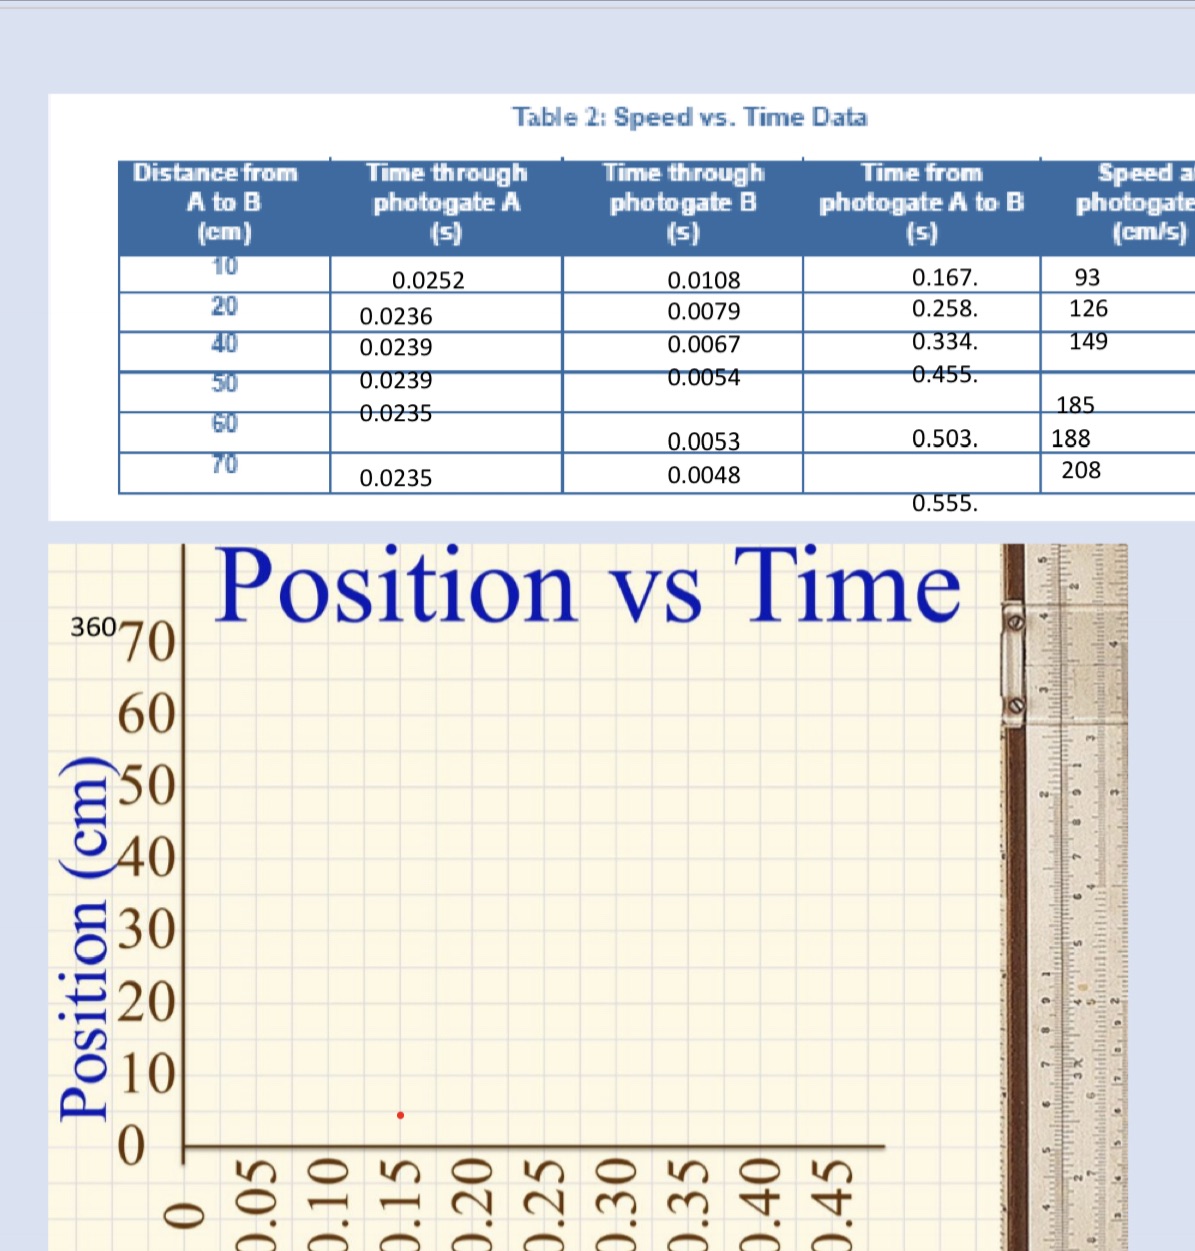
Table 2: Speed vs. Time Data Distance from Time through Time through Time from Speed A to B photogate A photogate B photogate A to B photogat (cm) (5) (5) (5) (cm/s) 10 0.0252 0.0108 0.167. 93 20 0.0236 0.0079 0.258. 126 40 0.0239 0.0067 0.334. 149 50 0.0239 0.0054 0.455. 60 0.0235 185 0.0053 0.503. 188 70 0.0235 0.0048 208 0.555. Position vs Time 36070 60 50 Position (cm) O
Step by Step Solution
There are 3 Steps involved in it
1 Expert Approved Answer
Step: 1 Unlock

Question Has Been Solved by an Expert!
Get step-by-step solutions from verified subject matter experts
Step: 2 Unlock
Step: 3 Unlock