

Question: i have to match these scatter plot coordinates to the graph listed. I'm having a hard time. -0.92 -0.76 0.00 0.66 0.82 The following are
i have to match these scatter plot coordinates to the graph listed. I'm having a hard time.
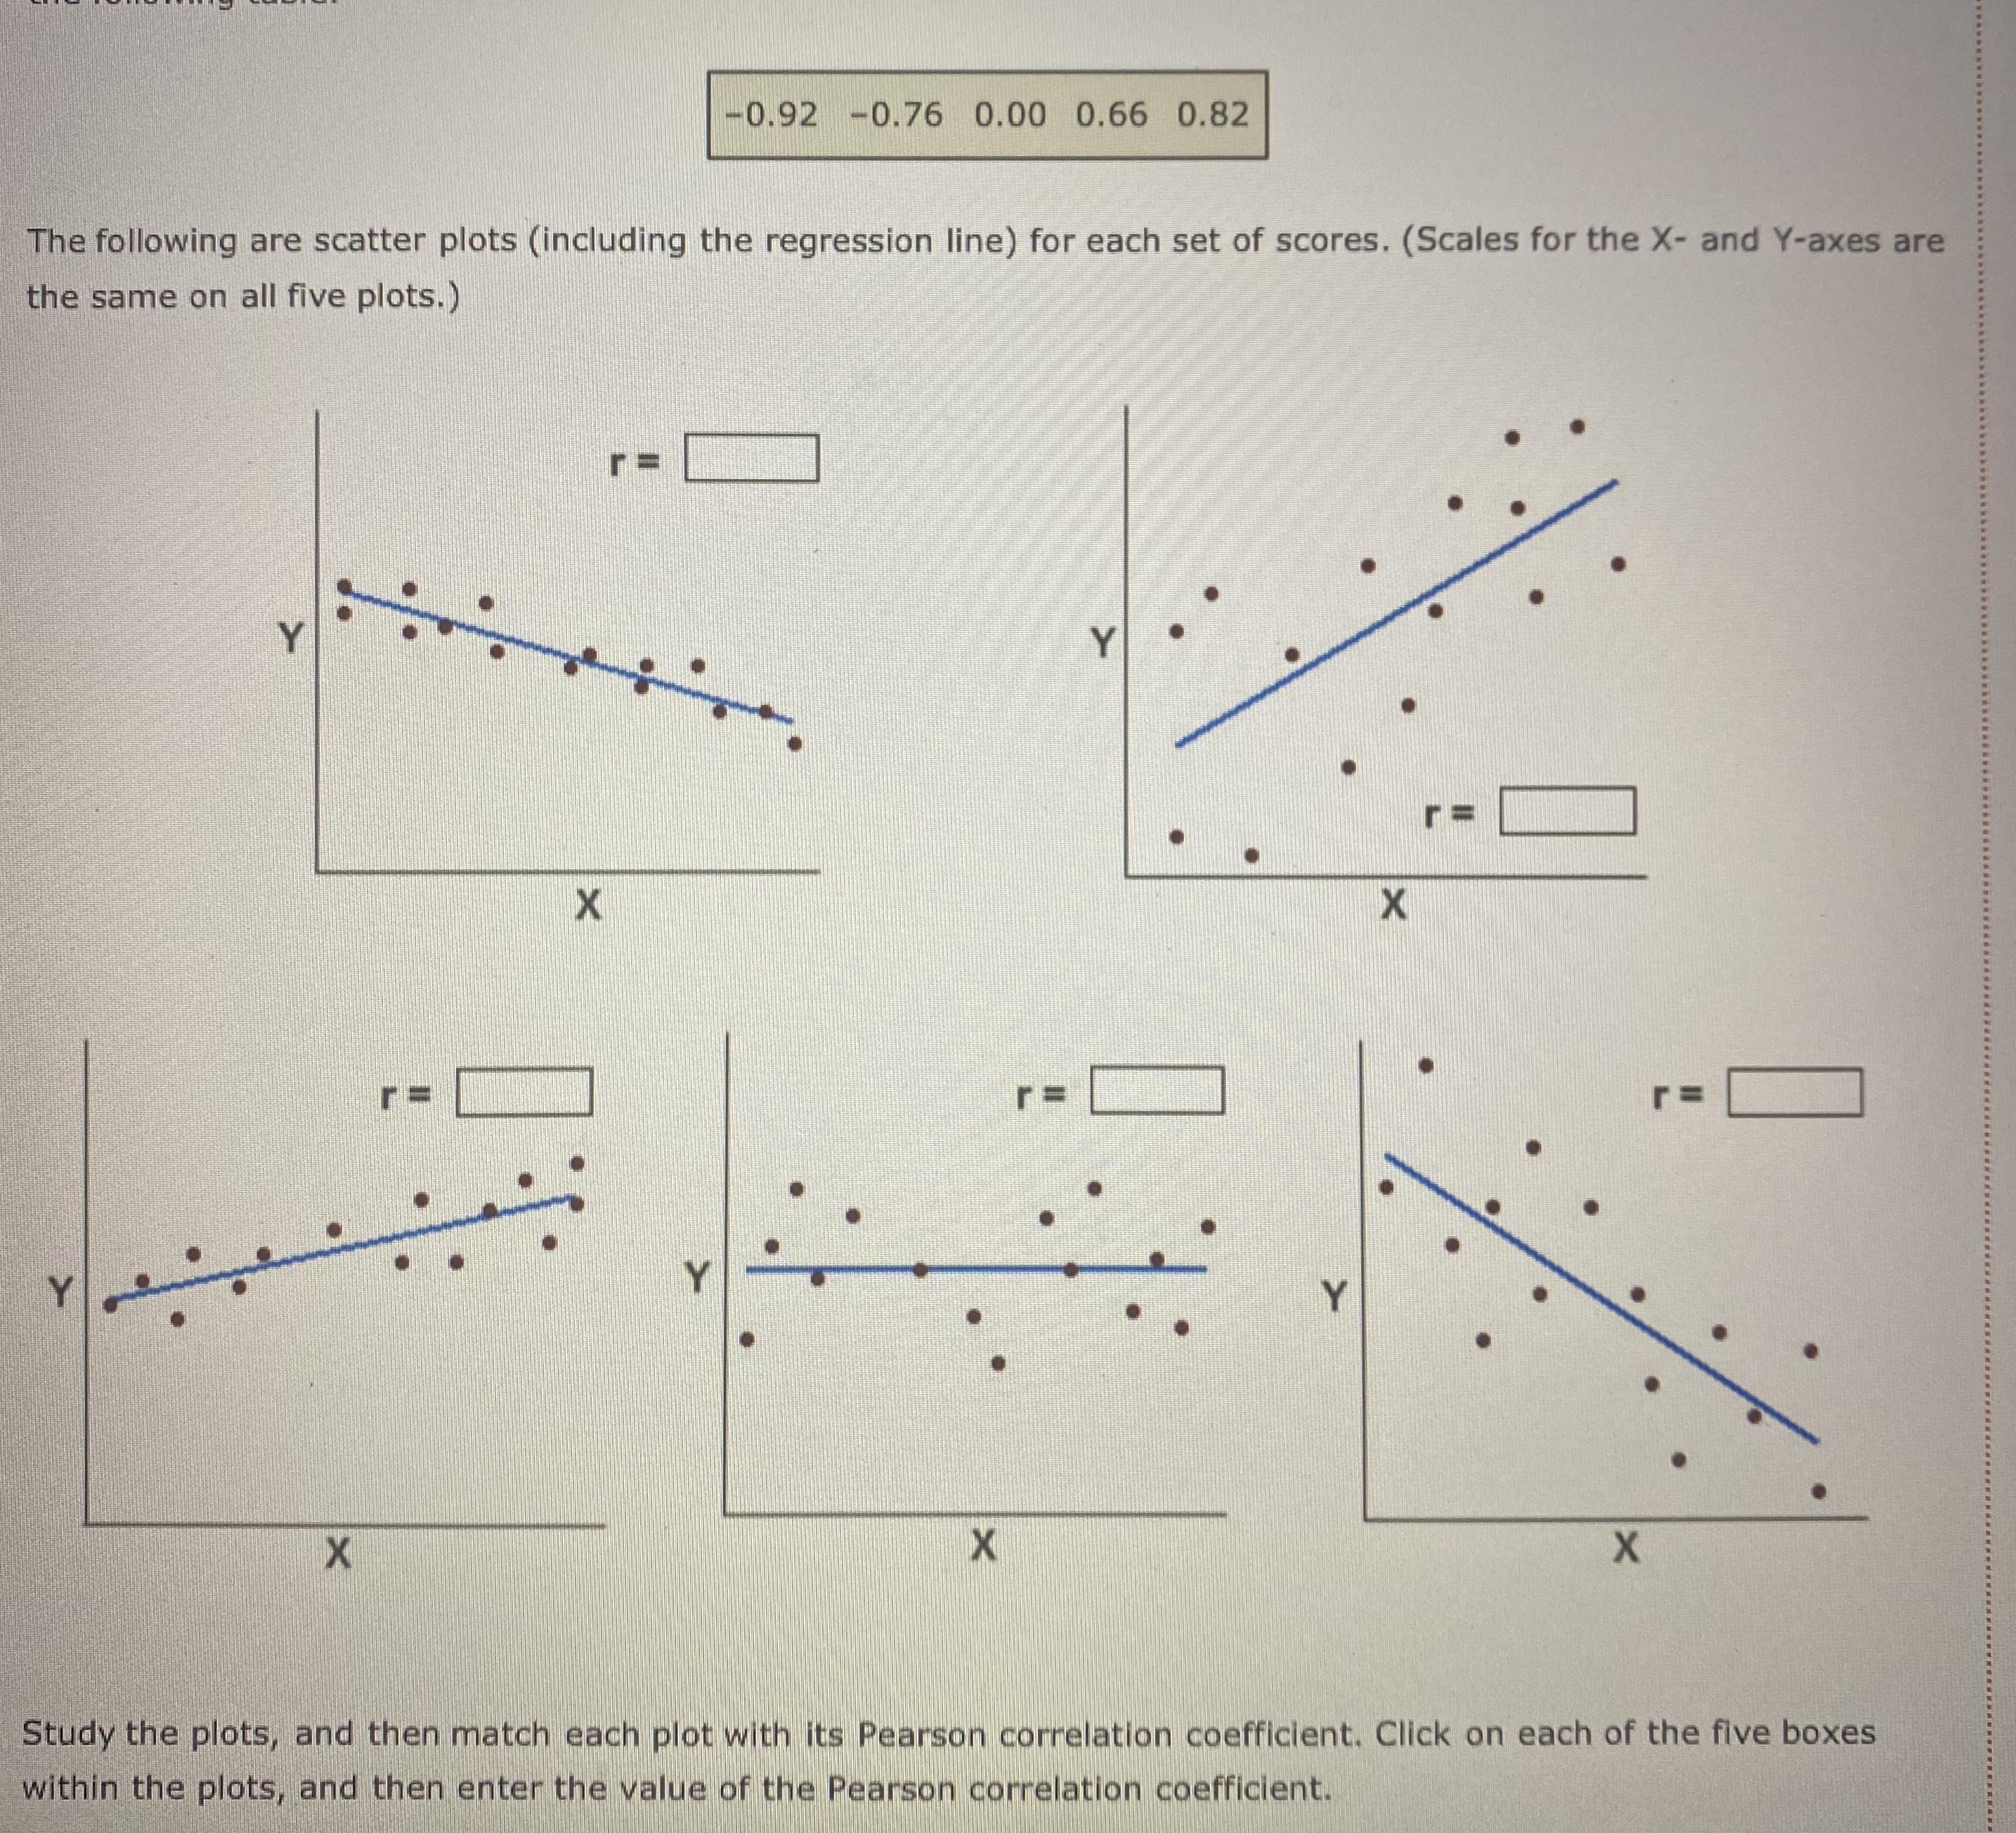
-0.92 -0.76 0.00 0.66 0.82 The following are scatter plots (including the regression line) for each set of scores. (Scales for the X- and Y-axes are the same on all five plots.) Y r= X X r= X X X Study the plots, and then match each plot with its Pearson correlation coefficient. Click on each of the five boxes within the plots, and then enter the value of the Pearson correlation coefficient
Step by Step Solution
There are 3 Steps involved in it
1 Expert Approved Answer
Step: 1 Unlock

Question Has Been Solved by an Expert!
Get step-by-step solutions from verified subject matter experts
Step: 2 Unlock
Step: 3 Unlock