

Question: I have to solve the questions using this Microsoft Excel file, but I don't know anything. Can someone explain the process. The file of Event
I have to solve the questions using this Microsoft Excel file, but I don't know anything. Can someone explain the process.
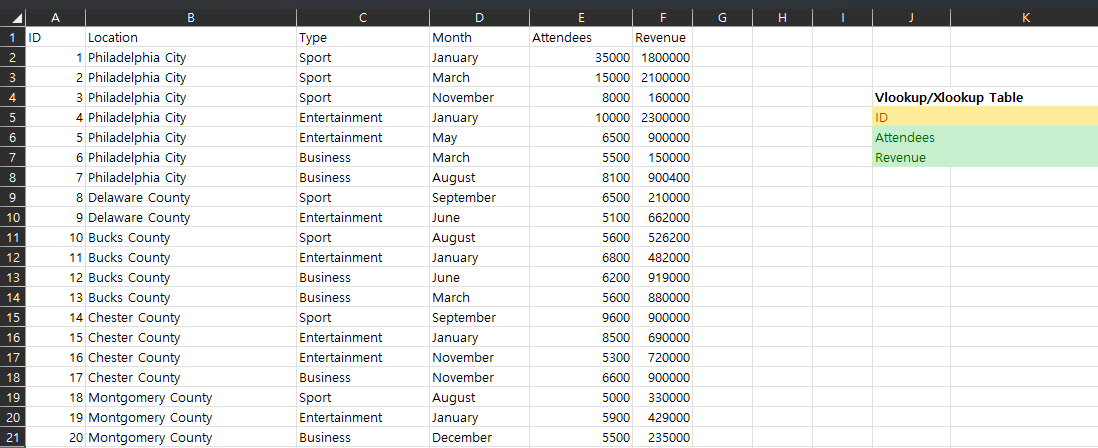
The file of Event data.xlsx shows the records of 20 events hosted last year in the Greater Philadelphia area that has more than 5,000 attendees. It records the location, event type, hosting month, number of attendees, and total revenue of each event.
1. Sort the data by Revenue, and use conditional formatting to highlight the event with the largest number of attendees and with the highest revenue. 2. Calculate the average, standard deviation, maximum, and minimum of Attendees and Revenue. 3. Add a column called Revenue per attendee, which calculates the revenue divided by number of attendees. Which event has the highest revenue per attendee and which as the lowest? Create another column City event with YES indicating it was hosted in Philadelphia City and NO indicating it was hosted in other counties (hint: use the IF function) 4. Use Pivot Table to calculate the total revenue for each event type, and use Pivot Table to calculate the total revenue for each month. Which event type receives the highest total revenue and which month receives the highest total revenue. 5. Use Pivot Chart to create a column or bar chart to highlight the average number of event attendees for each location. Add the chart title Average number of attendees. Change the layout for a better visualization. 6. Use the Vlookup or Xlookup to finish the table Vlookup/Xlookup Table so that it can automatically return the value of Attendees and Revenue with each ID value entered.
| ID | Location |
Step by Step Solution
There are 3 Steps involved in it

Get step-by-step solutions from verified subject matter experts