

Question: (i) How many variable (s) are involved in the above chart? Define also the types of variable (s) involved. (ii) What is the name of
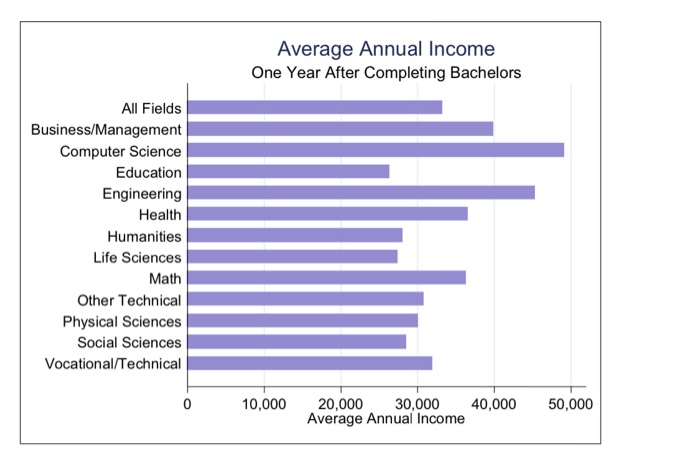
(i) How many variable (s) are involved in the above chart? Define also the types of variable (s) involved.
(ii) What is the name of the above chart?
(iii) Interpret in detail the results obtained in figure 1.
(iv) What are the alternative way (s) can be used to project the similar information? Why?
Step by Step Solution
There are 3 Steps involved in it
1 Expert Approved Answer
Step: 1 Unlock

Question Has Been Solved by an Expert!
Get step-by-step solutions from verified subject matter experts
Step: 2 Unlock
Step: 3 Unlock