

Question: -_ I_ I I I I _ _ _ Use R to answer the following questions. a. Introduce the vectors testscore and examgrade. Introduce the
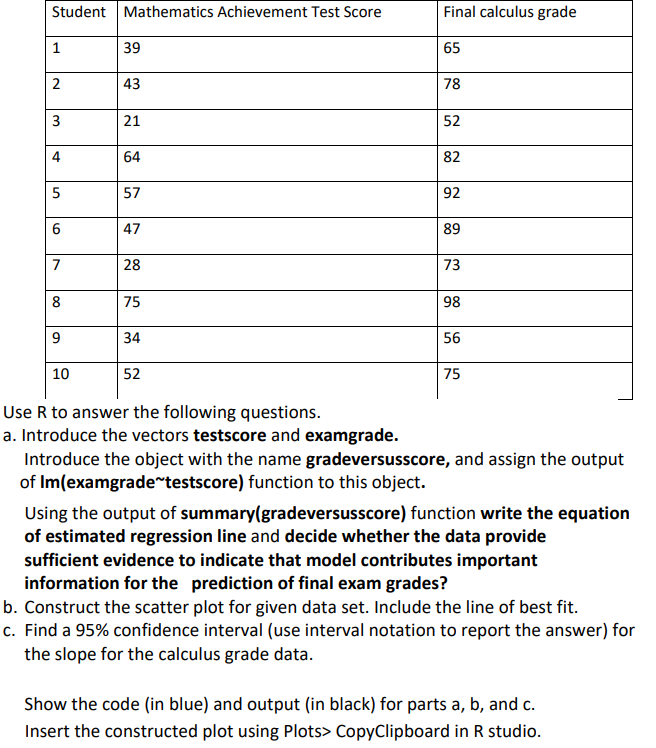
-_ I_ I I I I _ _ _ Use R to answer the following questions. a. Introduce the vectors testscore and examgrade. Introduce the object with the name gradeversusscore, and assign the output of Imtexamgradeestscore] function to this object. Using the output of summarvlgradeversusscore} function write the equation of estimated regression line and decide whether the data provide sufcient evidence to indicate that model contributes important information for the prediction of nal exam grades? b. Construct the scatter plot for given data set. Include the line of best fit. c. Find a 95% confidence interval {use interval notation to report the answer] for the slope for the calculus grade data. Show the code {in blue} and output [in black} for parts a, b, and c. Insert the constructed plot using Plots:- Covalipboard in R studio
Step by Step Solution
There are 3 Steps involved in it

Get step-by-step solutions from verified subject matter experts