

Question: I I want to create this graph above using R Studio using the data below Use ggplot to create the data visualization below. Width value
I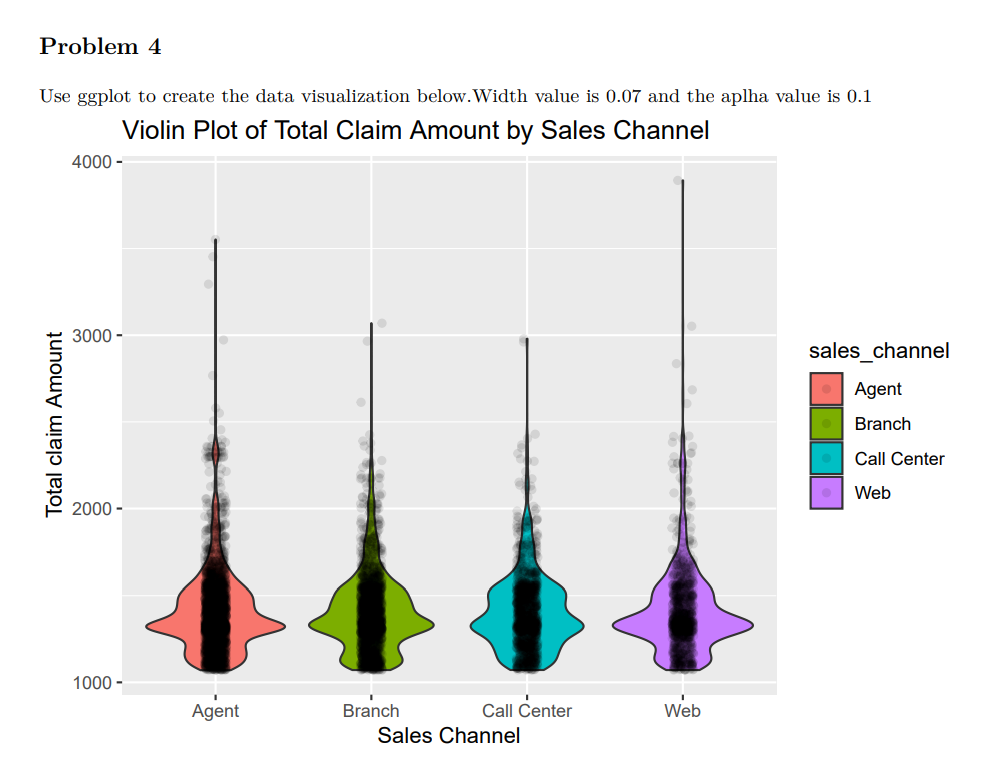 I want to create this graph above using R Studio using the data below
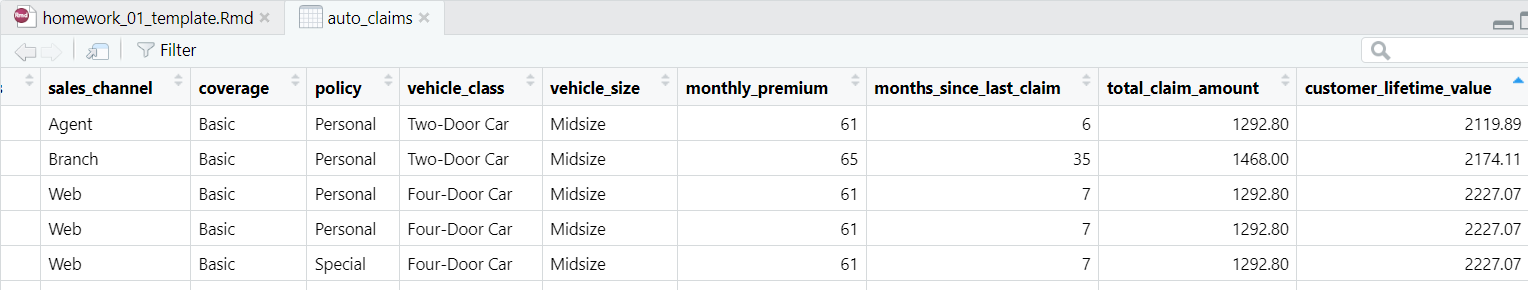
Use ggplot to create the data visualization below. Width value is 0.07 and the aplha value is 0.1 W/inlin Dlnt of Thtal Clnim Amount hw, Colac Channal homework_01_template.Rmd auto_claims Filter Use ggplot to create the data visualization below. Width value is 0.07 and the aplha value is 0.1 W/inlin Dlnt of Thtal Clnim Amount hw, Colac Channal homework_01_template.Rmd auto_claims Filter
Step by Step Solution
There are 3 Steps involved in it
1 Expert Approved Answer
Step: 1 Unlock

Question Has Been Solved by an Expert!
Get step-by-step solutions from verified subject matter experts
Step: 2 Unlock
Step: 3 Unlock