

Question: I. In the graph below: a ) Illustrate ( draw and label ) a set of typical or standard well - behaved short run (
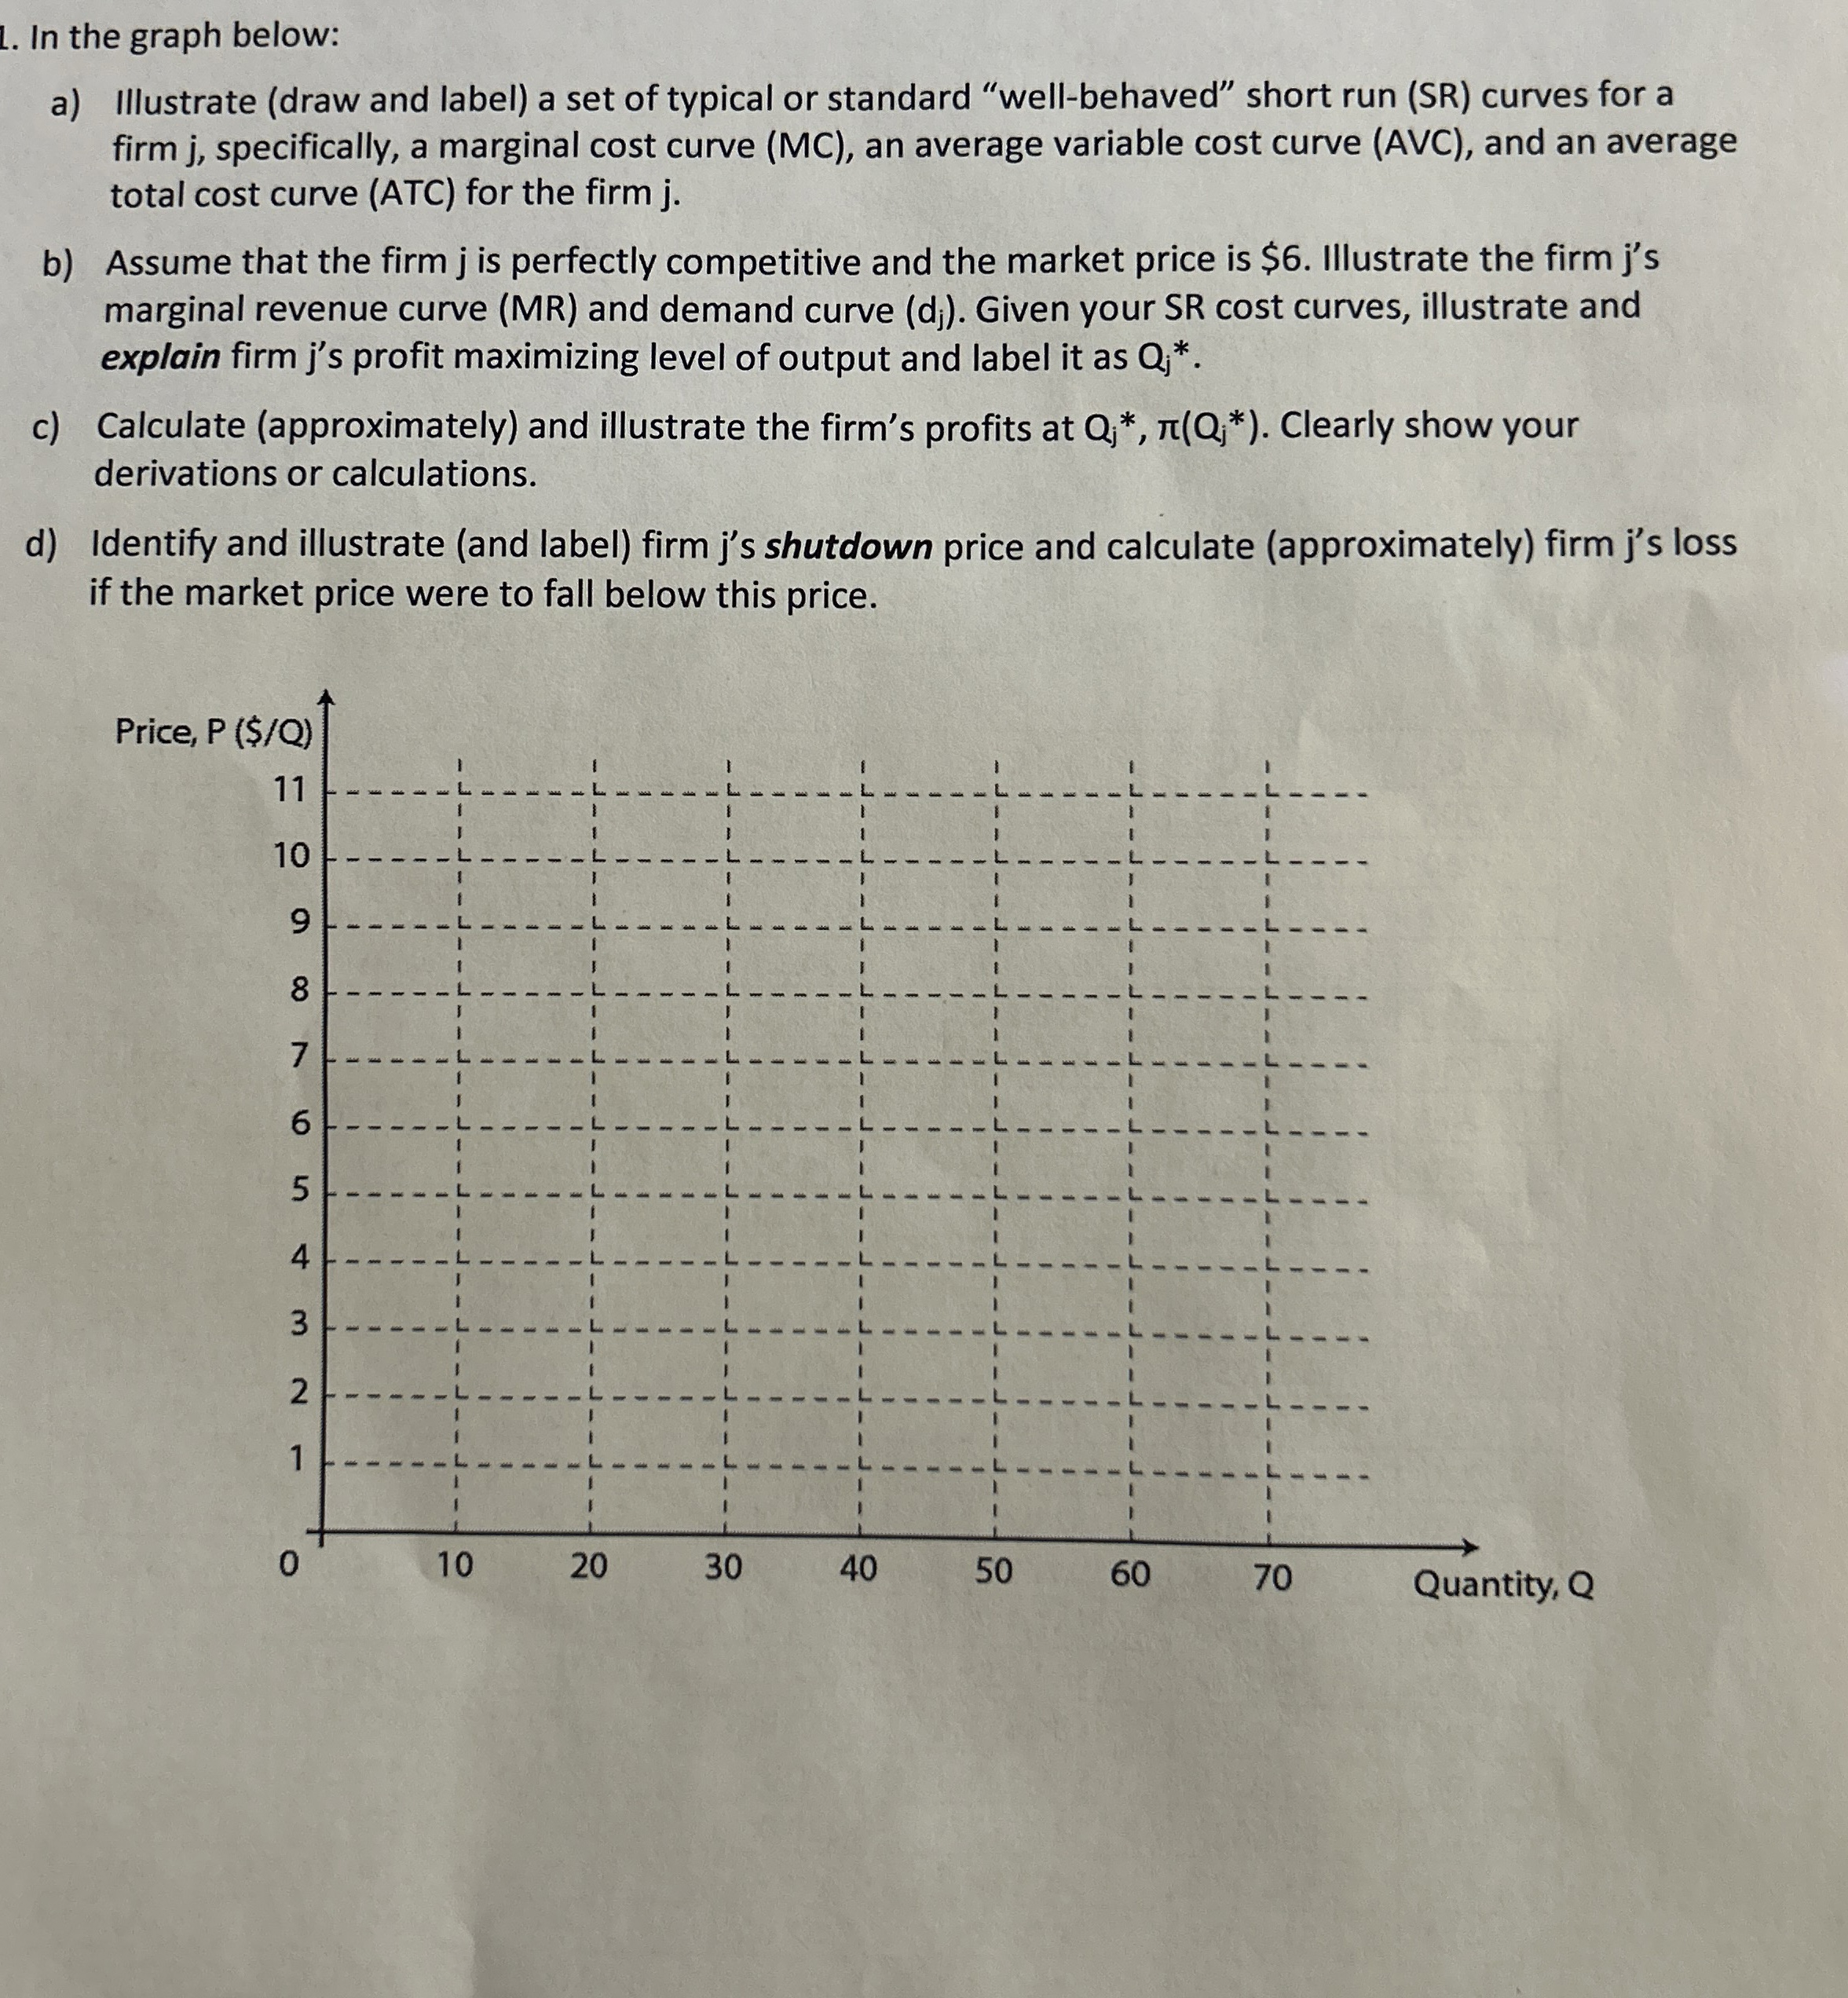
I. In the graph below:
a Illustrate draw and label a set of typical or standard "wellbehaved" short run SR curves for a firm j specifically, a marginal cost curve MC an average variable cost curve AVC and an average total cost curve ATC for the firm
b Assume that the firm is perfectly competitive and the market price is $ Illustrate the firm js marginal revenue curve MR and demand curve Given your SR cost curves, illustrate and explain firm s profit maximizing level of output and label it as
c Calculate approximately and illustrate the firm's profits at Clearly show your derivations or calculations.
d Identify and illustrate and label firm js shutdown price and calculate approximately firm js loss if the market price were to fall below this price.
Step by Step Solution
There are 3 Steps involved in it
1 Expert Approved Answer
Step: 1 Unlock

Question Has Been Solved by an Expert!
Get step-by-step solutions from verified subject matter experts
Step: 2 Unlock
Step: 3 Unlock