

Question: I just can't get the last 2 pieces. I included the error I am getting and hoping someone can help. I have a feeling it
I just can't get the last 2 pieces. I included the error I am getting and hoping someone can help. I have a feeling it is a typo somewhere but I just don't see anything wrong.
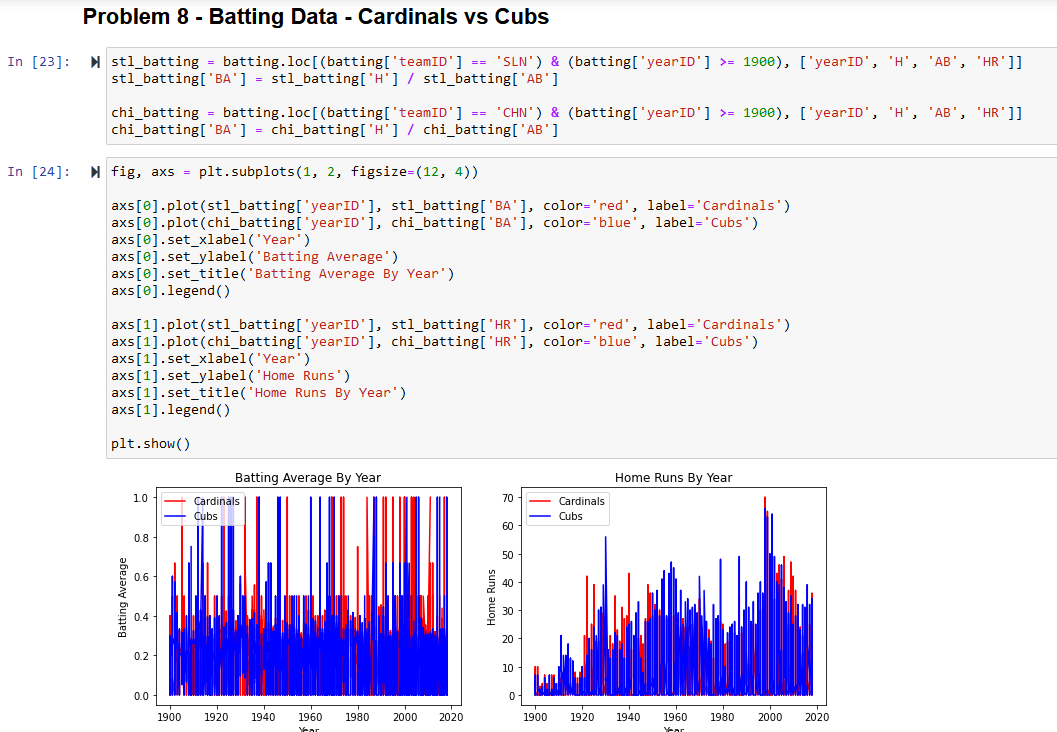
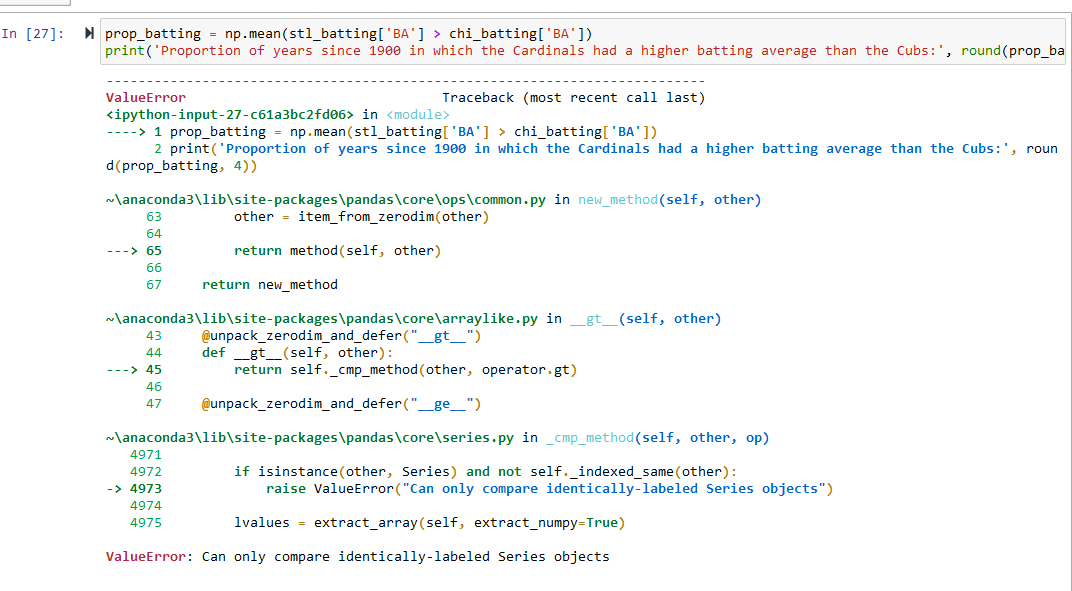
Problem 8: Batting Data - Cardinals vs. Cubs In this problem, we will calculate the batting average and the number of home runs for the St. Louis Cardinals and the Chicago Cubs during every season since 1900 . We will then compare the results. Note that within the Lahman Dataset, the teamID for the St. Louis Cardinals is listed as 'SLN ' and the teamID for the Chicago Cubs is listed as ' CHN '. Create a DataFrame named st1_batting that contains the number of hits, at-bats, and home runs for every season of the St. Louis Cardinals since 1900 . You can do this as follows: - Use loc to filter the batting DataFrame, keeping only the records for which teamID is equal to 'SLN' and for which the yearID is greater than or equal to 1900. - Use loc to select the yearID, H, AB, and HR columns. You can do this at the same time as when you are selecting the rows, or with a second use of loc. - Group the results by yearID, and then calculate grouped sums for the remaining columns. Add a new column named BA to the st1_batting DataFrame. This new column should be calculated by dividing the values in the H column by the values in the AB column. This should be done without using a loop. Create a DataFrame named chi_batting that contains the number of hits, at-bats, home runs, and batting average for every season of the Chicago Cubs since 1900 . The process is the same as above, except that you will use the teamID of ' CHN to select records corresponding to the Cubs. If you want to temporarily display st1_batting and chi_batting to check your work, you can check that in 1900 the batting average for the Cardinals was 0.291163 and the batting average for the Cubs was 0.260037 . Please remove the cod for displaying these DataFrames prior to submitting your work. Create a figure with two side-by-side line plots. Both plots should display two lines. The plot on the left should display the batting averages for the two teams for each year since 1900, and the one on the right should display the total number of home runs for the two teams for each year since 1900 . Create the figure according to the following specifications: - Set the figure size to [12,4]. - Select a single named color to use for the Cardinals in both plots. Select a different named color to use for the Cubs in both plots. - The x-axis should be labeled "Year", and should show tick marks corresponding to years since 1900. - The y-axes of the two plots should be labeled "Batting Average" and "Home Runs". - The titles should be "Batting Average By Year" and "Home Runs by Year". - Both plots should include a legend with two items: "Cardinals" and "Cubs". Display the figure using plt. show(). Use np.mean() along with an array comparison between two columns of stl_batting and chi_batting to determine the proportion of years since 1900 in which the Cardinals had a higher batting average than the cubs. Display the result rounded to four decimal places. Use np.mean() along with an array comparison between two columns of stl_batting and chi_batting to determine the proportion of years since 1900 in which the Cardinals had more home runs than the cubs. Display the result rounded to four decimal places. \begin{tabular}{l|l} In [1]: M & importnumpyasnpimportpandasaspdimportmatplotlib.pyplotasplt \end{tabular} In [2]: N oblem 8 - Batting Data - Cardinals vs Cubs In [27]: prop_batting = np.mean(stl_batting['BA'] > chi_batting['BA']) print('Proportion of years since 1900 in which the Cardinals had a higher batting average than the Cubs:', round(prop_ba ValueError Traceback (most recent call last) >1 prop_batting = np.mean (stl_batting['BA'] > chi_batting['BA' ]) 2 print('Proportion of years since 1900 in which the Cardinals had a higher batting average than the cubs: roun d(prop_batting, 4)) other = item_from_zerodim(other ) return method(self, other) return new_method @unpack_zerodim_and_defer("_gt_") def __gt__self, other): return self._cmp_method(other, operator.gt) @unpack_zerodim_and_defer("_ge_") 4971 4972 if isinstance(other, Series) and not self__indexed_same(other): -> 4973 raise ValueError "Can only compare identically-labeled Series objects") 4974 lvalues = extract_array ( self, extract_numpy=True ) ValueError: Can only compare identically-labeled Series objects
Step by Step Solution
There are 3 Steps involved in it

Get step-by-step solutions from verified subject matter experts