

Question: I just need help knowing what numbers to enter into excel. Below I will put images of each spread sheet.. You don't have to do
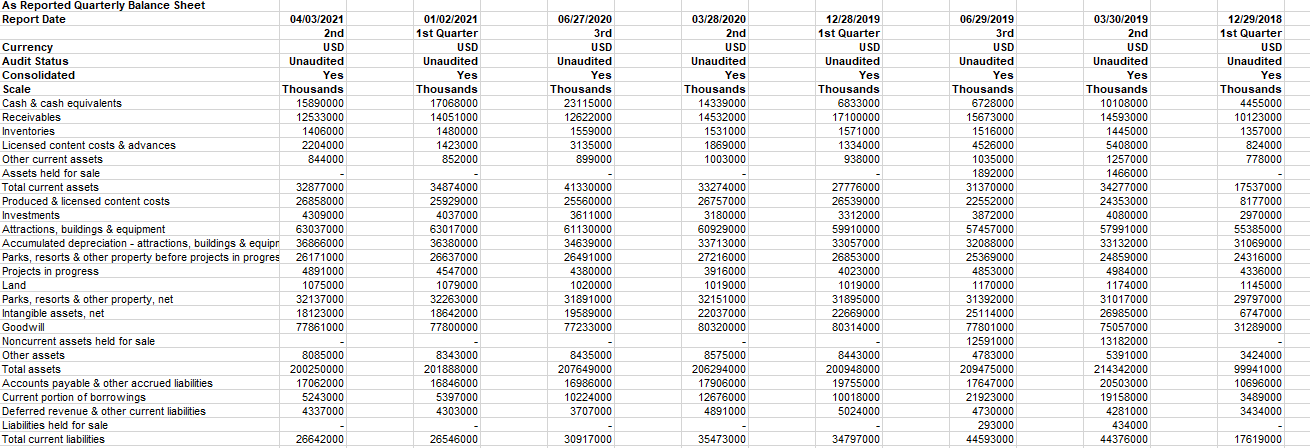
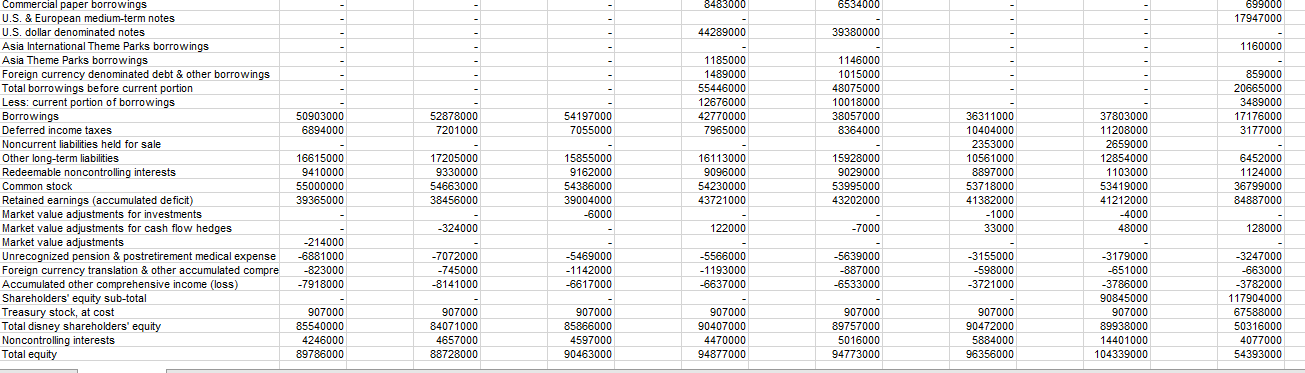
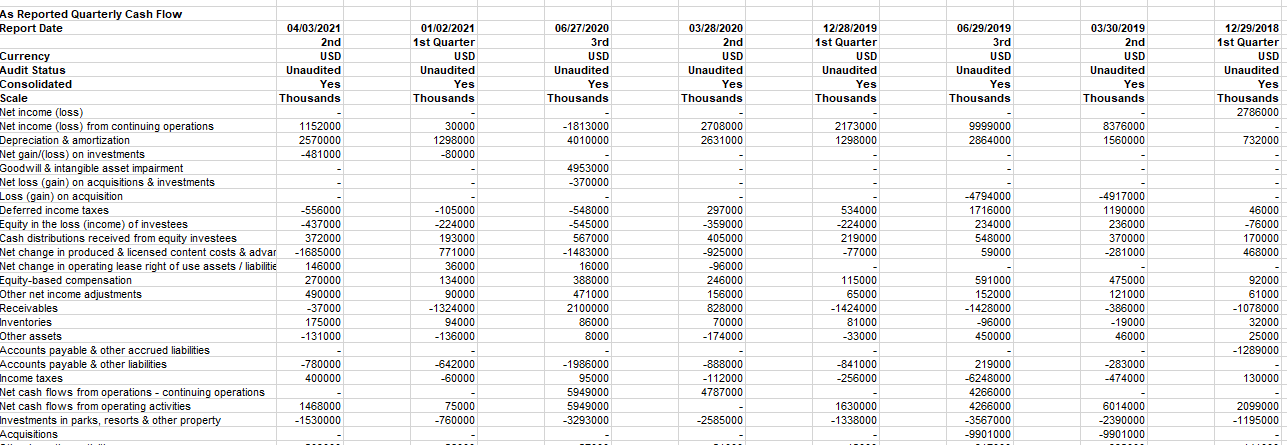
I just need help knowing what numbers to enter into excel. Below I will put images of each spread sheet.. You don't have to do the math excel will just struggling on which numbers to use. If you zoom in on the page you can see the numbers clearly.. Its for the most recent fiscal quarter and the same fiscal quarter a year before that.
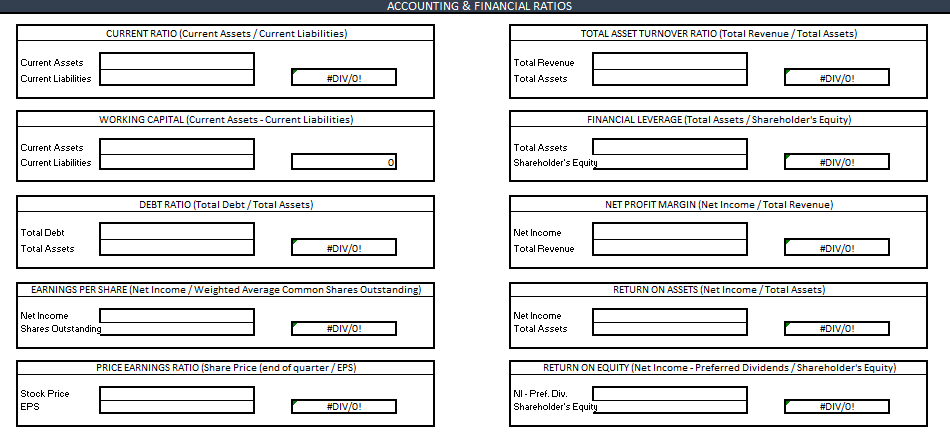
Financial Calculations: Calculate accurate financial ratios to assess the businesss current financial health. Specifically, calculate the following ratios:
- Working capital
- Current ratio
- Debt ratio
- Earnings per share
- Price/earnings ratio
- Total asset turnover ratio
- Financial leverage
- Net profit margin
- Return on assets
- Return on equity
- Balance Sheet
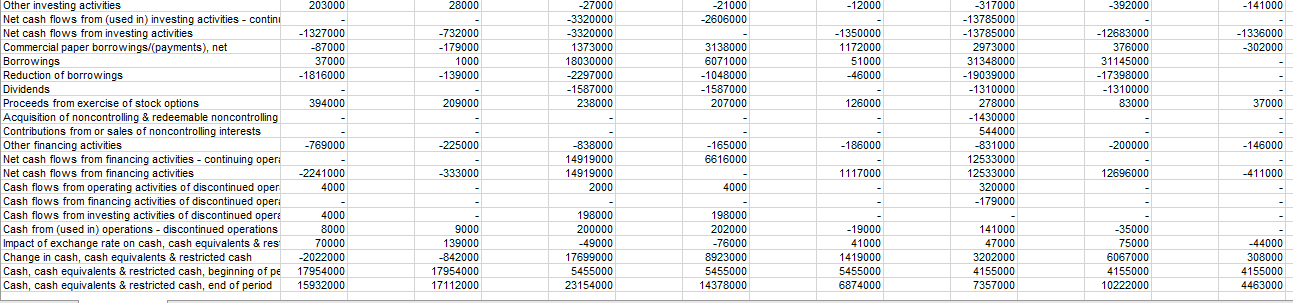
- Cash Flow
 Income Statement
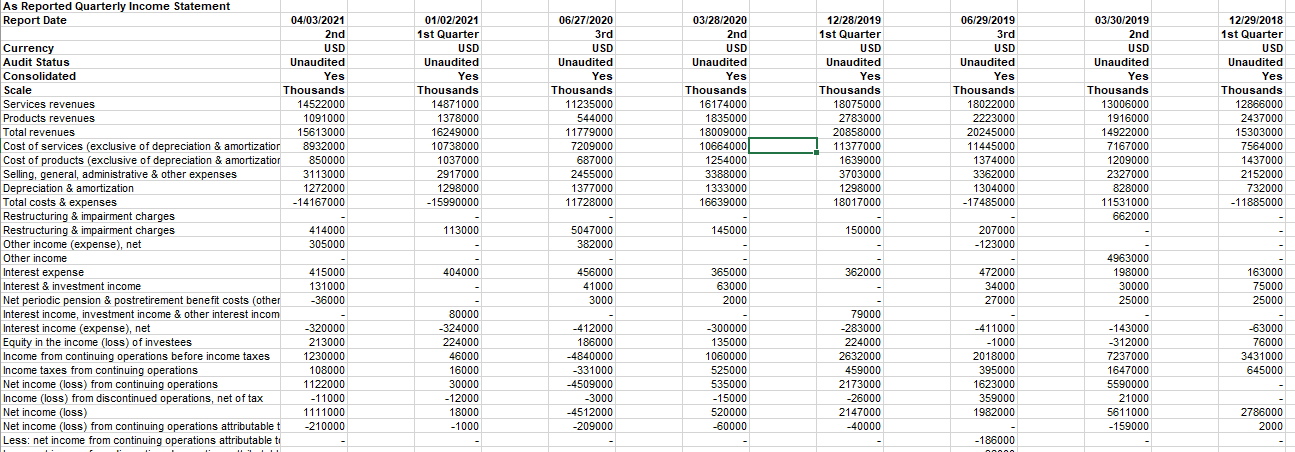
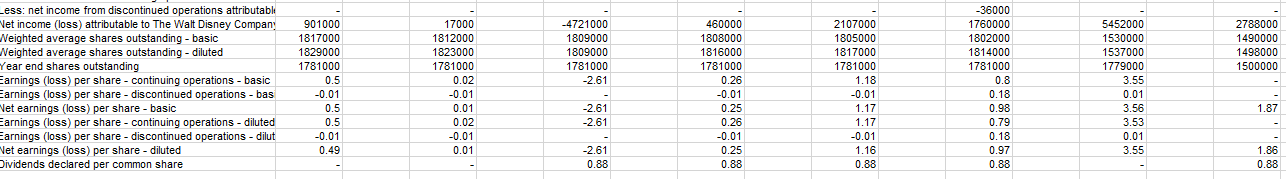
ACCOUNTING & FINANCIAL RATIOS CURRENT RATIO (Current Assets / Current Liabilities) TOTAL ASSET TURNOVER RATIO (Total Revenue / Total Assets) Current Assets Current Liabilities Total Revenue Total Assets #DIV/0! #DIV/0! WORKING CAPITAL (Current Assets - Current Liabilities) FINANCIAL LEVERAGE (Total Assets / Shareholder's Equity) Current Assets Current Liabilities Total Assets Shareholder's Equity #DIV/0! DEBT RATIO (Total Debt/Total Assets) NET PROFIT MARGIN (Net Income /Total Revenue) Total Debt Total Assets Net Income Total Revenue #DIV/0! #DIV/0! EARNINGS PER SHARE (Net Income /Weighted Average Common Shares Outstanding) RETURN ON ASSETS (Net Income / Total Assets) Net Income Shares Outstanding Net Income Total Assets #DIV/0! #DIV/0! PRICE EARNINGS RATIO (Share Price (end of quarter / EPS) RETURN ON EQUITY (Net Income - Preferred Dividends / Shareholder's Equity) Stock Price EPS NI - Pref. Div. Shareholder's Equity #DIV/0! #DIV/0! 01/02/2021 1st Quarter USD Unaudited Yes Thousands 17068000 14051000 1480000 1423000 852000 06/27/2020 3rd USD Unaudited Yes Thousands 23115000 12622000 1559000 3135000 899000 03/28/2020 2nd USD Unaudited Yes Thousands 14339000 14532000 1531000 1869000 1003000 12/28/2019 1st Quarter USD Unaudited Yes Thousands 6833000 17100000 1571000 1334000 938000 12/29/2018 1st Quarter USD Unaudited Yes Thousands 4455000 10123000 1357000 824000 778000 As Reported Quarterly Balance Sheet Report Date 04/03/2021 2nd Currency USD Audit Status Unaudited Consolidated Yes Scale Thousands Cash & cash equivalents 15890000 Receivables 12533000 Inventories 1406000 Licensed content costs & advances 2204000 Other current assets 844000 Assets held for sale Total current assets 32877000 Produced & licensed content costs 26858000 Investments 4309000 Attractions, buildings & equipment 63037000 Accumulated depreciation - attractions, buildings & equipr 36866000 Parks, resorts & other property before projects in progres 26171000 Projects in progress 4891000 Land 1075000 Parks, resorts & other property, net 32137000 Intangible assets, net 18123000 Goodwill 77861000 Noncurrent assets held for sale Other assets 8085000 Total assets 200250000 Accounts payable & other accrued liabilities 17062000 Current portion of borrowings 5243000 Deferred revenue & other current liabilities 4337000 Liabilities held for sale Total current liabilities 26642000 34874000 25929000 4037000 63017000 36380000 26637000 4547000 1079000 32263000 18642000 77800000 41330000 25560000 3611000 61130000 34639000 26491000 4380000 1020000 31891000 19589000 77233000 33274000 26757000 3180000 60929000 33713000 27216000 3916000 1019000 32151000 22037000 80320000 27776000 26539000 3312000 59910000 33057000 26853000 4023000 1019000 31895000 22669000 80314000 06/29/2019 3rd USD Unaudited Yes Thousands 6728000 15673000 1516000 4526000 1035000 1892000 31370000 22552000 3872000 57457000 32088000 25369000 4853000 1170000 31392000 25114000 77801000 12591000 4783000 209475000 17647000 21923000 4730000 293000 44593000 03/30/2019 2nd USD Unaudited Yes Thousands 10108000 14593000 1445000 5408000 1257000 1466000 34277000 24353000 4080000 57991000 33132000 24859000 4984000 1174000 31017000 26985000 75057000 13182000 5391000 214342000 20503000 19158000 4281000 434000 44376000 17537000 8177000 2970000 55385000 31069000 24316000 4336000 1145000 29797000 6747000 31289000 8343000 201888000 16846000 5397000 4303000 8435000 207649000 16986000 10224000 3707000 8575000 206294000 17906000 12676000 4891000 8443000 200948000 19755000 10018000 5024000 3424000 99941000 10696000 3489000 3434000 26546000 30917000 35473000 34797000 17619000 6534000 699000 17947000 39380000 - 1160000 - . 8483000 - 44289000 - 1185000 1489000 55446000 12676000 42770000 7965000 - 1146000 1015000 48075000 10018000 38057000 8364000 859000 20665000 3489000 17176000 3177000 50903000 6894000 52878000 7201000 54197000 7055000 Commercial paper borrowings U.S. & European medium-term notes U.S. dollar denominated notes Asia International Theme Parks borrowings Asia Theme Parks borrowings Foreign currency denominated debt & other borrowings Total borrowings before current portion Less: current portion of borrowings Borrowings Deferred income taxes Noncurrent liabilities held for sale Other long-term liabilities Redeemable noncontrolling interests Common stock Retained earnings (accumulated deficit) Market value adjustments for investments Market value adjustments for cash flow hedges Market value adjustments Unrecognized pension & postretirement medical expense Foreign currency translation & other accumulated compre Accumulated other comprehensive income (loss) Shareholders' equity sub-total Treasury stock, at cost Total disney shareholders' equity Noncontrolling interests Total equity 16615000 9410000 55000000 39365000 17205000 9330000 54663000 38456000 15855000 9162000 54386000 39004000 -6000 16113000 9096000 54230000 43721000 15928000 9029000 53995000 43202000 36311000 10404000 2353000 10561000 8897000 53718000 41382000 -1000 33000 37803000 11208000 2659000 12854000 1103000 53419000 41212000 -4000 48000 6452000 1124000 36799000 84887000 -324000 122000 -7000 128000 -214000 -6881000 -823000 -7918000 -7072000 -745000 -8141000 -5469000 -1142000 -6617000 -5566000 -1193000 -6637000 -5639000 -887000 -6533000 -3155000 -598000 -3721000 -3179000 -651000 -3786000 90845000 907000 89938000 14401000 104339000 -3247000 -663000 -3782000 117904000 67588000 50316000 4077000 54393000 907000 85540000 4246000 89786000 907000 84071000 4657000 88728000 907000 85866000 4597000 90463000 907000 89757000 5016000 94773000 907000 90407000 4470000 94877000 907000 90472000 5884000 96356000 01/02/2021 1st Quarter USD Unaudited Yes Thousands 06/27/2020 3rd USD Unaudited Yes Thousands 03/28/2020 2nd USD Unaudited Yes Thousands 12/28/2019 1st Quarter USD Unaudited Yes Thousands 06/29/2019 3rd USD Unaudited Yes Thousands 03/30/2019 2nd USD Unaudited Yes Thousands 12/29/2018 1st Quarter USD Unaudited Yes Thousands 2786000 30000 1298000 -80000 -1813000 4010000 2708000 2631000 2173000 1298000 9999000 2864000 8376000 1560000 732000 - As Reported Quarterly Cash Flow Report Date 04/03/2021 2nd Currency USD Audit Status Unaudited Consolidated Yes Scale Thousands Net income (loss) Net income (loss) from continuing operations 1152000 Depreciation & amortization 2570000 Net gain/(loss) on investments -481000 Goodwill & intangible asset impairment Net loss (gain) on acquisitions & investments Loss (gain) on acquisition - Deferred income taxes -556000 Equity in the loss (income) of investees -437000 Cash distributions received from equity investees 372000 Net change in produced & licensed content costs & advar -1685000 Net change in operating lease right of use assets / liabilitie 146000 Equity-based compensation 270000 Other net income adjustments 490000 Receivables -37000 Inventories 175000 Other assets -131000 Accounts payable & other accrued liabilities Accounts payable & other liabilities -780000 Income taxes 400000 Net cash flows from operations - continuing operations Net cash flows from operating activities 1468000 Investments in parks, resorts & other property -1530000 Acquisitions 4953000 -370000 - -548000 -545000 567000 -1483000 16000 388000 471000 2100000 86000 8000 534000 -224000 219000 -77000 -4794000 1716000 234000 548000 59000 -4917000 1190000 236000 370000 -281000 -105000 -224000 193000 771000 36000 134000 90000 -1324000 94000 -136000 46000 -76000 170000 468000 297000 -359000 405000 -925000 -96000 246000 156000 828000 70000 -174000 115000 65000 -1424000 81000 -33000 591000 152000 -1428000 -96000 450000 475000 121000 -386000 -19000 46000 92000 61000 -1078000 32000 25000 -1289000 -642000 -60000 -888000 - 112000 4787000 -841000 -256000 -283000 -474000 -1986000 95000 5949000 5949000 -3293000 130000 75000 -760000 1630000 -1338000 219000 -6248000 4266000 4266000 -3567000 -9901000 6014000 -2390000 -9901000 2099000 -1195000 -2585000 203000 28000 - 12000 -141000 -21000 -2606000 -1336000 -302000 -1327000 -87000 37000 -1816000 -732000 -179000 1000 -139000 -27000 -3320000 -3320000 1373000 18030000 -2297000 -1587000 238000 3138000 6071000 -1048000 -1587000 207000 -1350000 1172000 51000 -46000 -392000 - -12683000 376000 31145000 -17398000 -1310000 83000 394000 209000 126000 -317000 -13785000 -13785000 2973000 31348000 -19039000 -1310000 278000 -1430000 544000 -831000 12533000 12533000 320000 -179000 Other investing activities Net cash flows from (used in) investing activities - contin Net cash flows from investing activities Commercial paper borrowings/(payments), net Borrowings Reduction of borrowings Dividends Proceeds from exercise of stock options Acquisition of noncontrolling & redeemable noncontrolling Contributions from or sales of noncontrolling interests Other financing activities Net cash flows from financing activities - continuing operi Net cash flows from financing activities Cash flows from operating activities of discontinued oper Cash flows from financing activities of discontinued operi Cash flows from investing activities of discontinued opera Cash from (used in) operations - discontinued operations Impact of exchange rate on cash, cash equivalents & res Change in cash, cash equivalents & restricted cash Cash, cash equivalents & restricted cash, beginning of pe Cash, cash equivalents & restricted cash, end of period 37000 -769000 -225000 - -200000 -186000 -146000 -165000 6616000 -838000 14919000 14919000 2000 -333000 1117000 12696000 -411000 -2241000 4000 4000 4000 8000 70000 -2022000 17954000 15932000 9000 139000 -842000 17954000 17112000 198000 200000 -49000 17699000 5455000 23154000 198000 202000 -76000 8923000 5455000 14378000 -19000 41000 1419000 5455000 6874000 141000 47000 3202000 4155000 7357000 -35000 75000 6067000 4155000 10222000 -44000 308000 4155000 4463000 01/02/2021 1st Quarter USD Unaudited Yes Thousands 14871000 1378000 16249000 10738000 1037000 2917000 1298000 -15990000 06/27/2020 3rd USD Unaudited Yes Thousands 11235000 544000 11779000 7209000 687000 2455000 1377000 11728000 03/28/2020 2nd USD Unaudited Yes Thousands 16174000 1835000 18009000 10664000 1254000 3388000 1333000 16639000 12/28/2019 1st Quarter USD Unaudited Yes Thousands 18075000 2783000 20858000 11377000 1639000 3703000 1298000 18017000 06/29/2019 3rd USD Unaudited Yes Thousands 18022000 2223000 20245000 11445000 1374000 3362000 1304000 -17485000 03/30/2019 2nd USD Unaudited Yes Thousands 13006000 1916000 14922000 7167000 1209000 2327000 828000 11531000 662000 12/29/2018 1st Quarter USD Unaudited Yes Thousands 12866000 2437000 15303000 7564000 1437000 2152000 732000 -11885000 As Reported Quarterly Income Statement Report Date 04/03/2021 2nd Currency USD Audit Status Unaudited Consolidated Yes Scale Thousands Services revenues 14522000 Products revenues 1091000 Total revenues 15613000 Cost of services (exclusive of depreciation & amortizatior 8932000 Cost of products (exclusive of depreciation & amortization 850000 Selling, general, administrative & other expenses 3113000 Depreciation & amortization 1272000 Total costs & expenses -14167000 Restructuring & impairment charges Restructuring & impairment charges 414000 Other income (expense), net 305000 Other income Interest expense 415000 Interest & investment income 131000 Net periodic pension & postretirement benefit costs (other -36000 Interest income, investment income & other interest incom Interest income (expense), net -320000 Equity in the income (loss) of investees 213000 Income from continuing operations before income taxes 1230000 Income taxes from continuing operations 108000 Net income (loss) from continuing operations 1122000 Income (loss) from discontinued operations, net of tax -11000 Net income (loss) 1111000 Net income (loss) from continuing operations attributablet -210000 Less: net income from continuing operations attributable to 113000 145000 150000 5047000 382000 207000 -123000 404000 362000 456000 41000 3000 365000 63000 2000 472000 34000 27000 - 4963000 198000 30000 25000 163000 75000 25000 80000 -324000 224000 46000 16000 30000 -12000 18000 -1000 -412000 186000 -4840000 -331000 -4509000 -3000 -4512000 -209000 79000 -283000 224000 2632000 459000 2173000 -26000 2147000 -40000 -300000 135000 1060000 525000 535000 - 15000 520000 -60000 -63000 76000 3431000 645000 -411000 -1000 2018000 395000 1623000 359000 1982000 -143000 -312000 7237000 1647000 5590000 21000 5611000 -159000 2786000 2000 -186000 nnnnn 2788000 -4721000 1809000 1809000 1781000 -2.61 1490000 1498000 1500000 Less: net income from discontinued operations attributable Net income (loss) attributable to The Walt Disney Company Weighted average shares outstanding - basic Weighted average shares outstanding - diluted Year end shares outstanding Earnings (loss) per share - continuing operations - basic Earnings (loss) per share - discontinued operations - bas Net earnings (loss) per share - basic Earnings (loss) per share - continuing operations - diluted Earnings (loss) per share - discontinued operations - dilut Vet earnings (loss) per share - diluted Dividends declared per common share 901000 1817000 1829000 1781000 0.5 -0.01 0.5 0.5 -0.01 0.49 17000 1812000 1823000 1781000 0.02 -0.01 0.01 0.02 -0.01 0.01 460000 1808000 1816000 1781000 0.26 -0.01 0.25 0.26 -0.01 0.25 0.88 2107000 1805000 1817000 1781000 1.18 -0.01 1.17 1.17 -0.01 1.16 0.88 -36000 1760000 1802000 1814000 1781000 0.8 0.18 0.98 0.79 0.18 0.97 0.88 5452000 1530000 1537000 1779000 3.55 0.01 3.56 3.53 0.01 3.55 1.87 -2.61 -2.61 -2.61 0.88 1.86 0.88
Step by Step Solution
There are 3 Steps involved in it

Get step-by-step solutions from verified subject matter experts