

Question: I just need help with calculating these ratios. I will post the numbers that correlate wih the ratios that need to be calculated Experiential Data
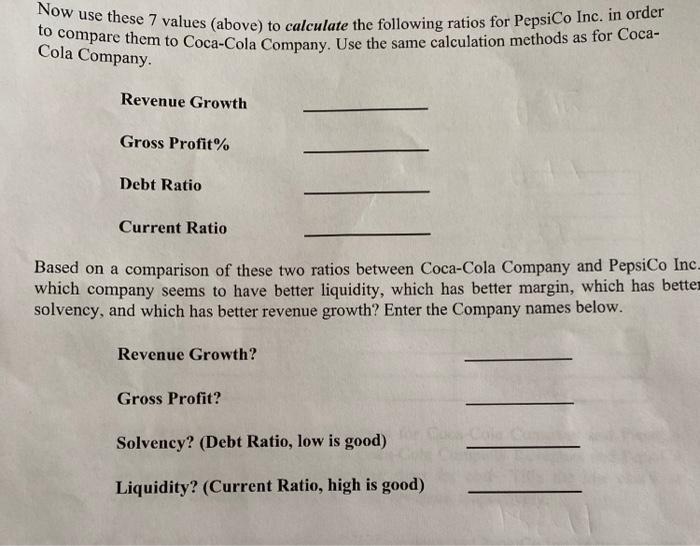
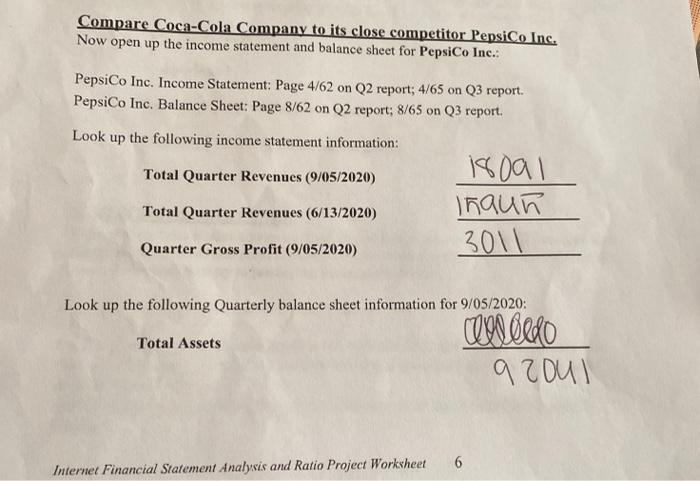
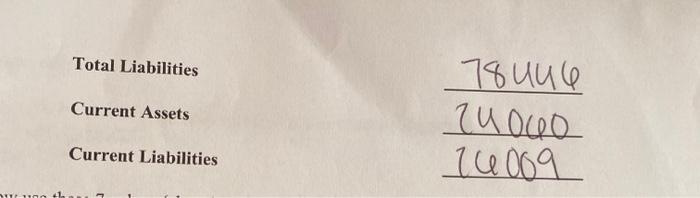
Now use these 7 values (above) to calculate the following ratios for PepsiCo Inc. in order Cola Company Revenue Growth Gross Profit% Debt Ratio Current Ratio Based on a comparison of these two ratios between Coca-Cola Company and PepsiCo Inc. which company seems to have better liquidity, which has better margin, which has better solvency, and which has better revenue growth? Enter the Company names below. Revenue Growth? Gross Profit? Solvency? (Debt Ratio, low is good) Liquidity? (Current Ratio, high is good) Compare Coca-Cola Company to its close competitor PepsiCo Inc. Now open up the income statement and balance sheet for PepsiCo Inc.: PepsiCo Inc. Income Statement: Page 4/62 on Q2 report; 4/65 on Q3 report. PepsiCo Inc. Balance Sheet: Page 8/62 on Q2 report; 8/65 on Q3 report. Look up the following income statement information: Total Quarter Revenues (9/05/2020) Total Quarter Revenues (6/13/2020) 18001 Thaun 3011 Quarter Gross Profit (9/05/2020) Look up the following Quarterly balance sheet information for 9/05/2020: Total Assets w 000 9 roul 6 Internet Financial Statement Analysis and Ratio Project Worksheet Total Liabilities Current Assets 11 14000 1 004 Current Liabilities
Step by Step Solution
There are 3 Steps involved in it

Get step-by-step solutions from verified subject matter experts