

Question: I just need help with part g please! (1) Consider the following data about the spreading of a disease in a closed population: - The
I just need help with part g please!
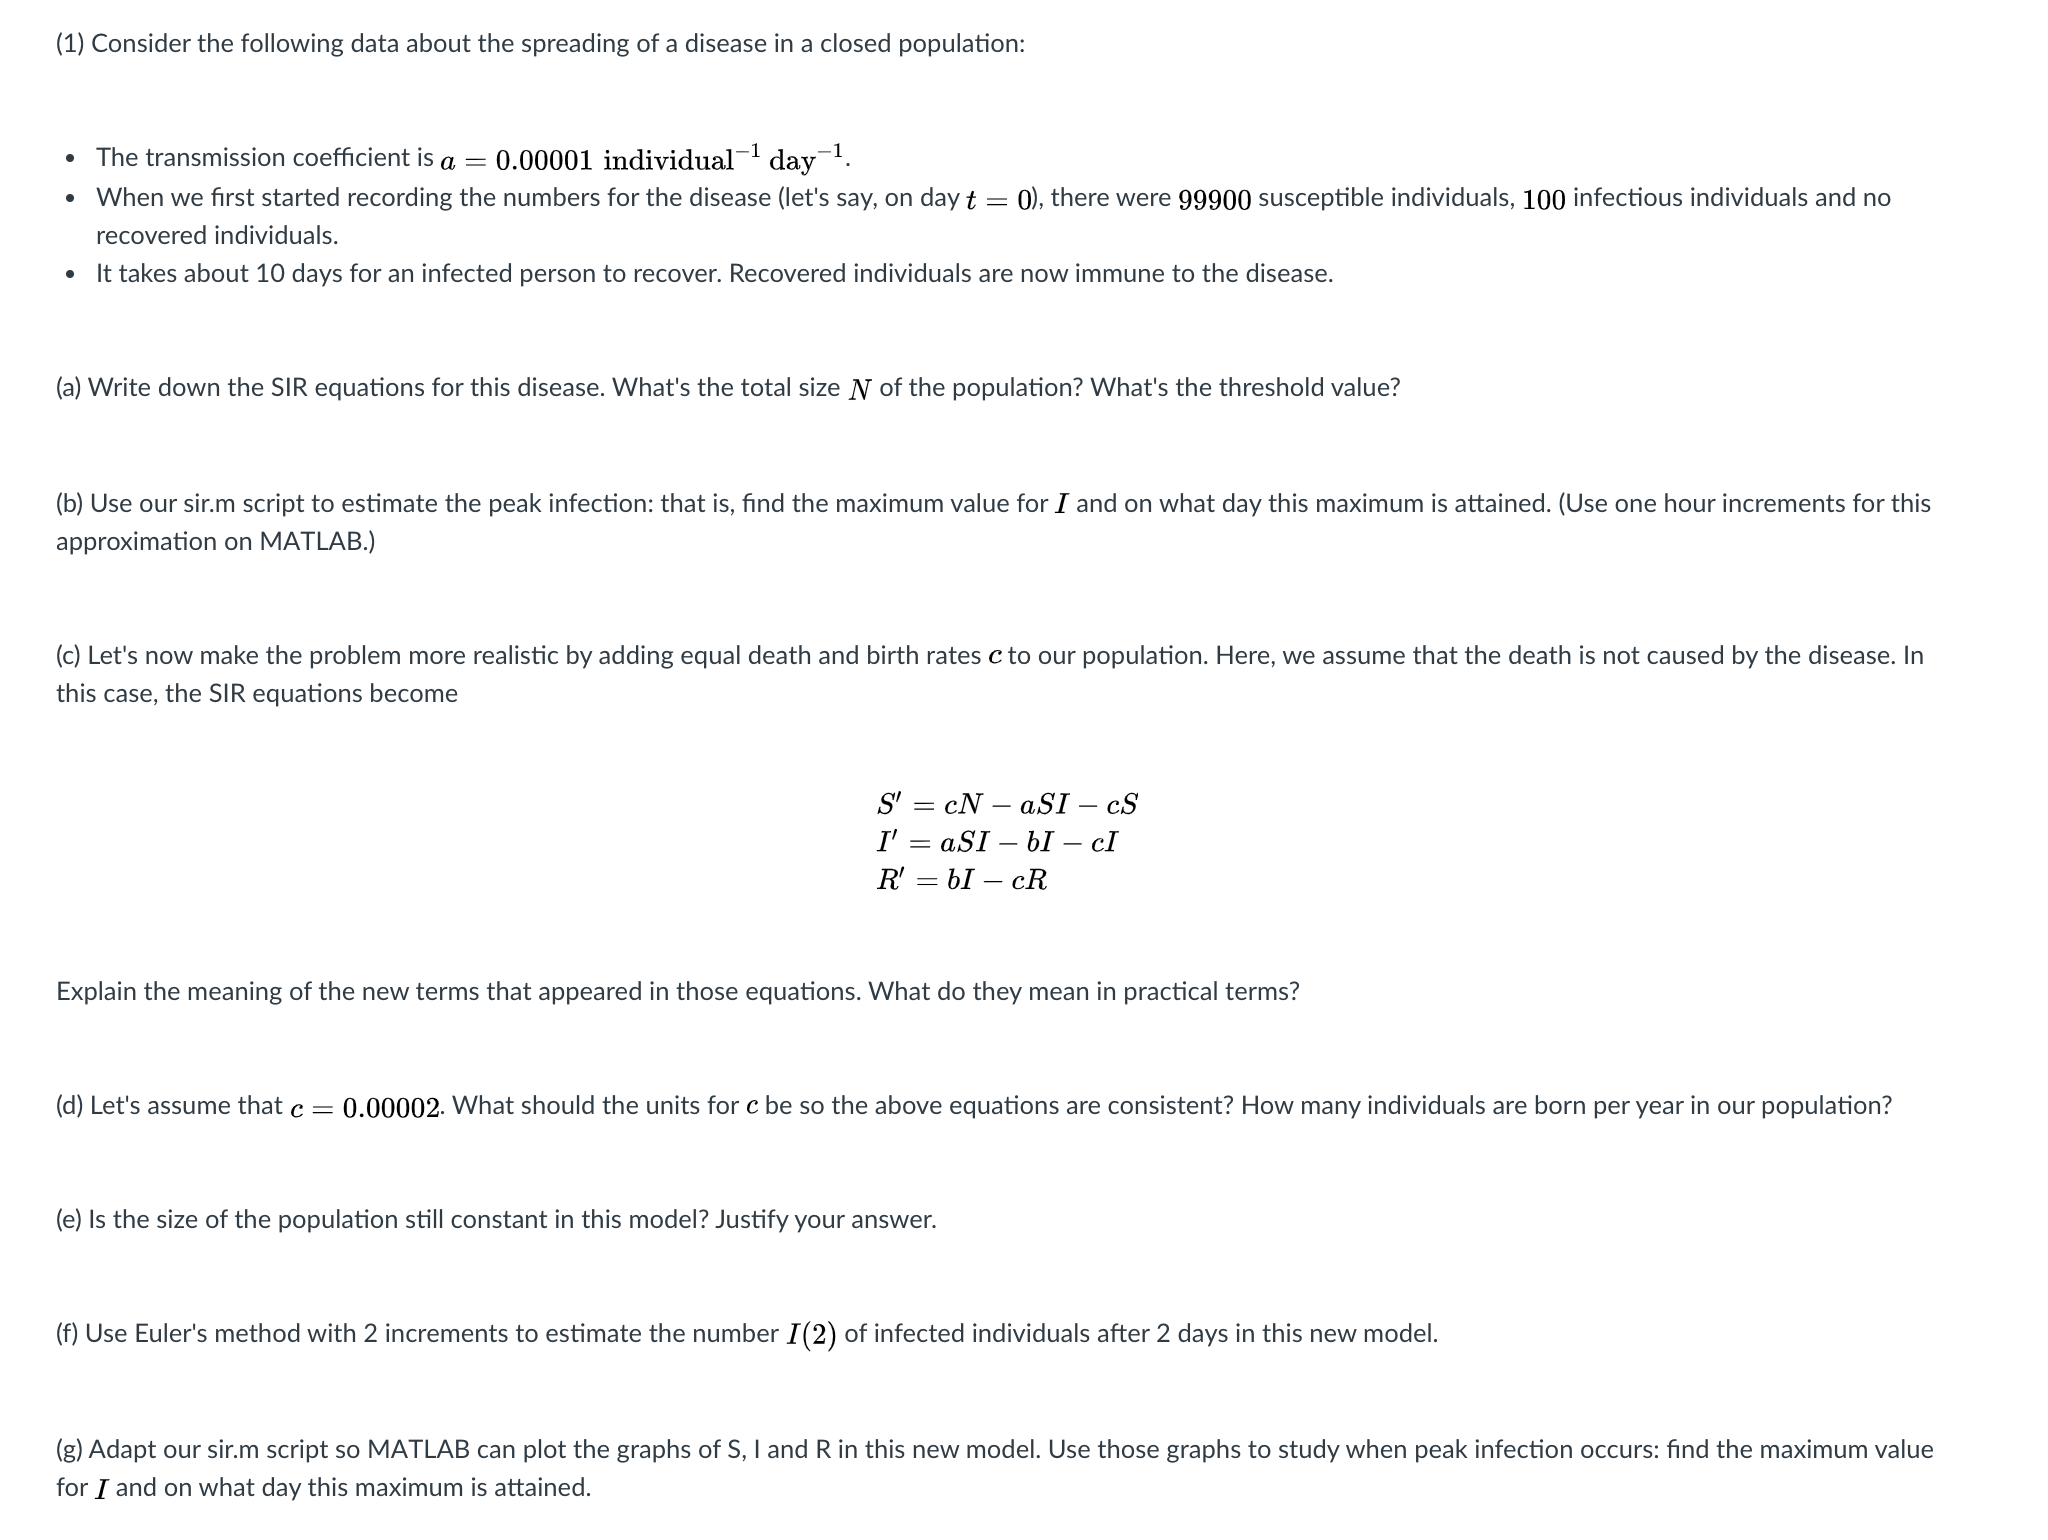
(1) Consider the following data about the spreading of a disease in a closed population: - The transmission coefcient is a, = 0.00001 individual1 day1- - When we rst started recording the numbers for the disease (let's say, on dayt = 0), there were 99900 susceptible individuals, 100 infectious individuals and no recovered individuals. . It takes about 10 days for an infected person to recover. Recovered individuals are now immune to the disease. (a) Write down the SIR equations for this disease. What's the total size N of the population? What's the threshold value? (b) Use our sir.m script to estimate the peak infection: that is, nd the maximum value for I and on what day this maximum is attained. (Use one hour increments for this approximation on MATLAB.) (c) Let's now make the problem more realistic by adding equal death and birth rates cto our population. Here, we assume that the death is not caused by the disease. In this case, the SIR equations become S'=cNaSIcS I'=aSIbIcI R'=bIcR Explain the meaning of the new terms that appeared in those equations. What do they mean in practical terms? (d) Let's assume that c = 0,00002. What should the units for c be so the above equations are consistent? How many individuals are born per year in our population? (e) Is the size of the population still constant in this model?Justify your answer. (1') Use Euler's method with 2 increments to estimate the number I(2) of infected individuals after 2 days in this new model. (g) Adapt our sir.m script so MATLAB can plot the graphs of S, land R in this new model. Use those graphs to study when peak infection occurs: nd the maximum value for I and on what day this maximum is attained
Step by Step Solution
There are 3 Steps involved in it

Get step-by-step solutions from verified subject matter experts