

Question: I just need help with question 3 and 4 Analyse the data provided in the given table {Recession beginning in 2008} U.S. Business Cycle from
I just need help with question 3 and 4
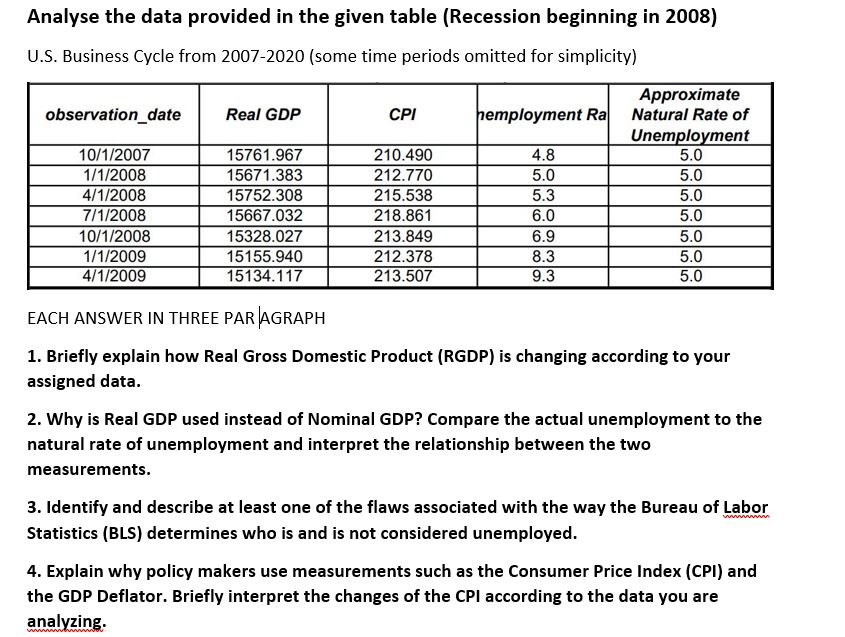
Analyse the data provided in the given table {Recession beginning in 2008} U.S. Business Cycle from 20022020 (some time periods omitted for simplicity) Approximate employment R: Natural Rate of Unem r 0 meat Real GDP 3 observation_date 1011 .1200? 1111112003 4111112003 ?l1f2003 101112003 11112009 41'11'2009 157051.967 156T1.333 15?52.303 1555?.032 15323.02? 15155340 151 34.1 1? 210.490 212.??0 21 5.533 218.351 21 3.349 212.3?8 21 3.50? 513'?\" 5"? woo woo 5"?\" 1-" on 0 EACH ANSWER IN THREE PAR LAGRAPH 1. Briefly explain how Real Gross Domestic Product {060?} is changing according to your assigned data. 2. 1Why is Real GDP used instead of Nominal GDP'EI Compare the actual unemployment to the natural rate of unemployment and interpret the relationship between the two measurements. 3. Identifyr and describe at least one of the flaws associated with the way the Bureau of Labor Statistics {3L5} determines who is and is not considered unemployed. 4. Explain why poiicy makers use measurements such as the Consumer Price Index (CPI) and the GDP Deator. Briefly interpret the changes of the (2P! according to the data you are analyzing
Step by Step Solution
There are 3 Steps involved in it

Get step-by-step solutions from verified subject matter experts