

Question: I keep making a simple mistake somewhere along the line that gets me all wrong answers. Vertical Analysis. Visit the Student Companion site to access
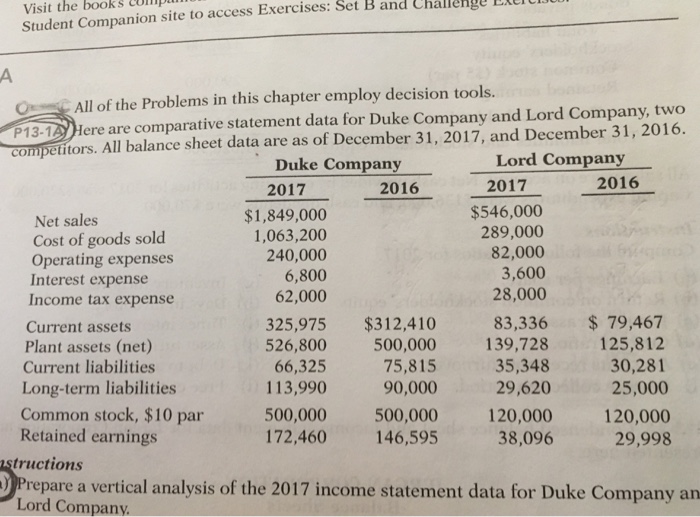
Visit the Student Companion site to access Exercises: books up Set B and Challenge Elerti All of the Problems in this chapter employ decision tools. P13-1Here are comparative statement data for Duke Company and Lord Company, two competitors. All balance sheet data are as of December 31, 2017, and December 31, 2016. Duke Company Lord Company 2016 2017 $1,849,000 1,063,200 240,000 2017 $546,000 289,000 82,000 2016 Net sales Cost of goods sold Operating expenses Interest expense 6,800 3,600 28,000 Income tax expense Current assets Plant assets (net) Current liabilities Long-term liabilities Common stock, $10 par Retained earnings 62,000 325,975 $312,410 526,800 500,000 139,728 66,325 113,990 500,000 500,000 120,000 120,000 172,460 146,595 83,336 79,467 125,812 30,281 25,000 75,815 90,000 35,348 29,620 38,096 29,998 tructions Prepare a vertical analysis of the 2017 income statement data for Duke Company an Lord Company
Step by Step Solution
There are 3 Steps involved in it

Get step-by-step solutions from verified subject matter experts