

Question: I know how to make the basic linear models, but can someone help me with a through c using R? This data set includes GPA,
I know how to make the basic linear models, but can someone help me with a through c using R?
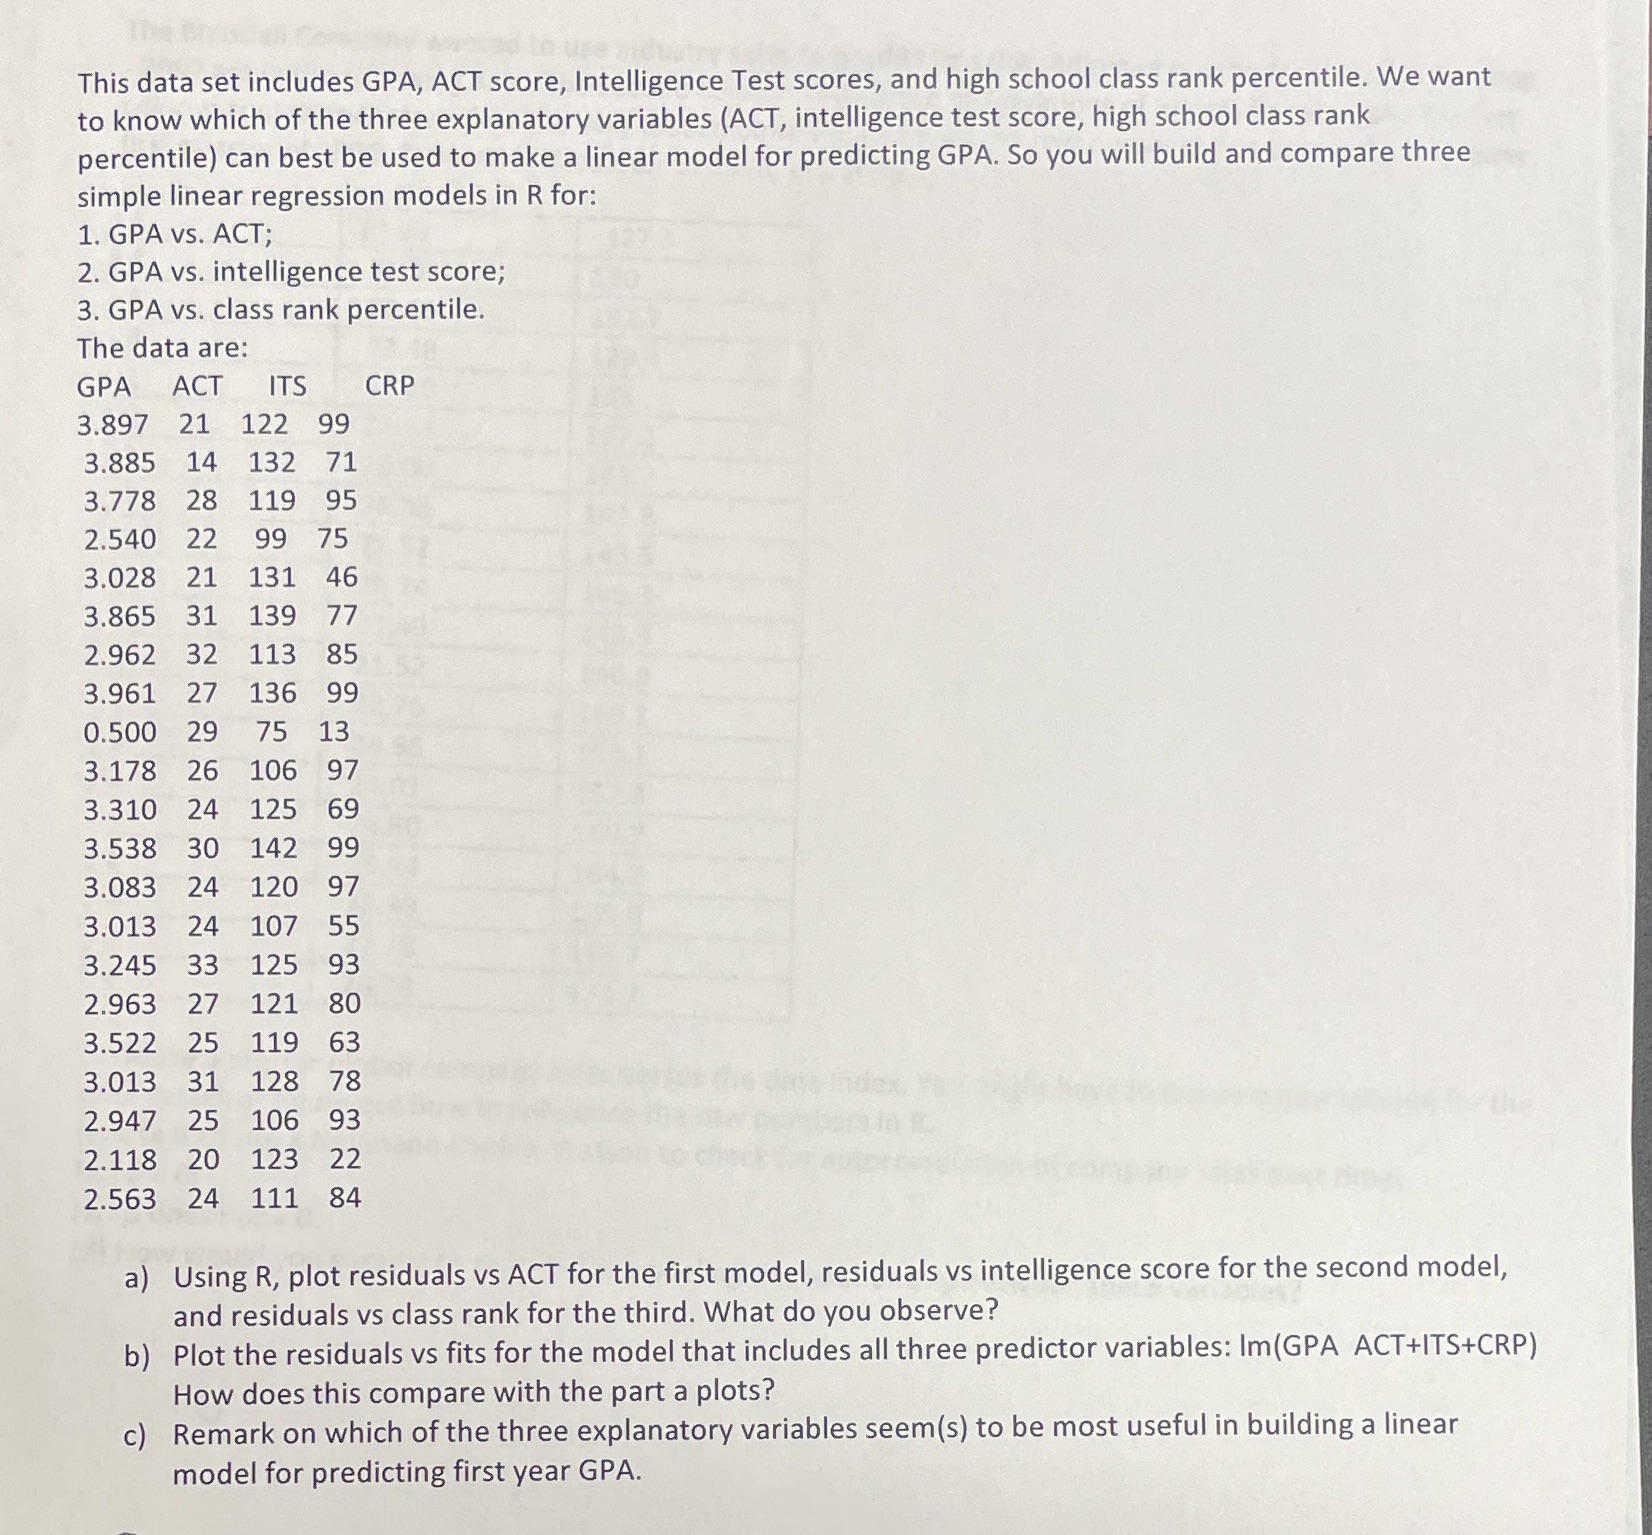
This data set includes GPA, ACT score, Intelligence Test scores, and high school class rank percentile. We want to know which of the three explanatory variables (ACT, intelligence test score, high school class rank percentile) can best be used to make a linear model for predicting GPA. So you will build and compare three simple linear regression models in R for: 1. GPA VS. ACT; 2. GPA vs. intelligence test score; 3. GPA vs. class rank percentile. The data are: GPA ACT ITS CRP 3.897 21 122 99 3.885 14 132 71 3.778 28 119 95 2.540 22 99 75 3.028 21 131 46 3.865 31 139 77 2.962 32 113 85 3.961 27 136 99 0.500 29 75 13 3.178 26 106 97 3.310 24 125 69 3.538 30 142 99 3.083 24 120 97 3.013 3 24 107 55 3.245 33 125 93 2.963 27 121 80 3.522 25 119 63 3.013 31 128 78 2.947 25 106 93 2.118 20 123 22 2.563 24 111 84 a) Using R, plot residuals vs ACT for the first model, residuals vs intelligence score for the second model, and residuals vs class rank for the third. What do you observe? b) Plot the residuals vs fits for the model that includes all three predictor variables: Im(GPA ACT+ITS+CRP) How does this compare with the part a plots? c) Remark on which of the three explanatory variables seem(s) to be most useful in building a linear model for predicting first year GPA
Step by Step Solution
There are 3 Steps involved in it

Get step-by-step solutions from verified subject matter experts