

Question: I know how to plot, but can't seem to make it close enough. If someone can give me their graphing of it, I would appreciate
I know how to plot, but can't seem to make it close enough. If someone can give me their graphing of it, I would appreciate it. Part 3 is asking for a score of 36 on the first test.
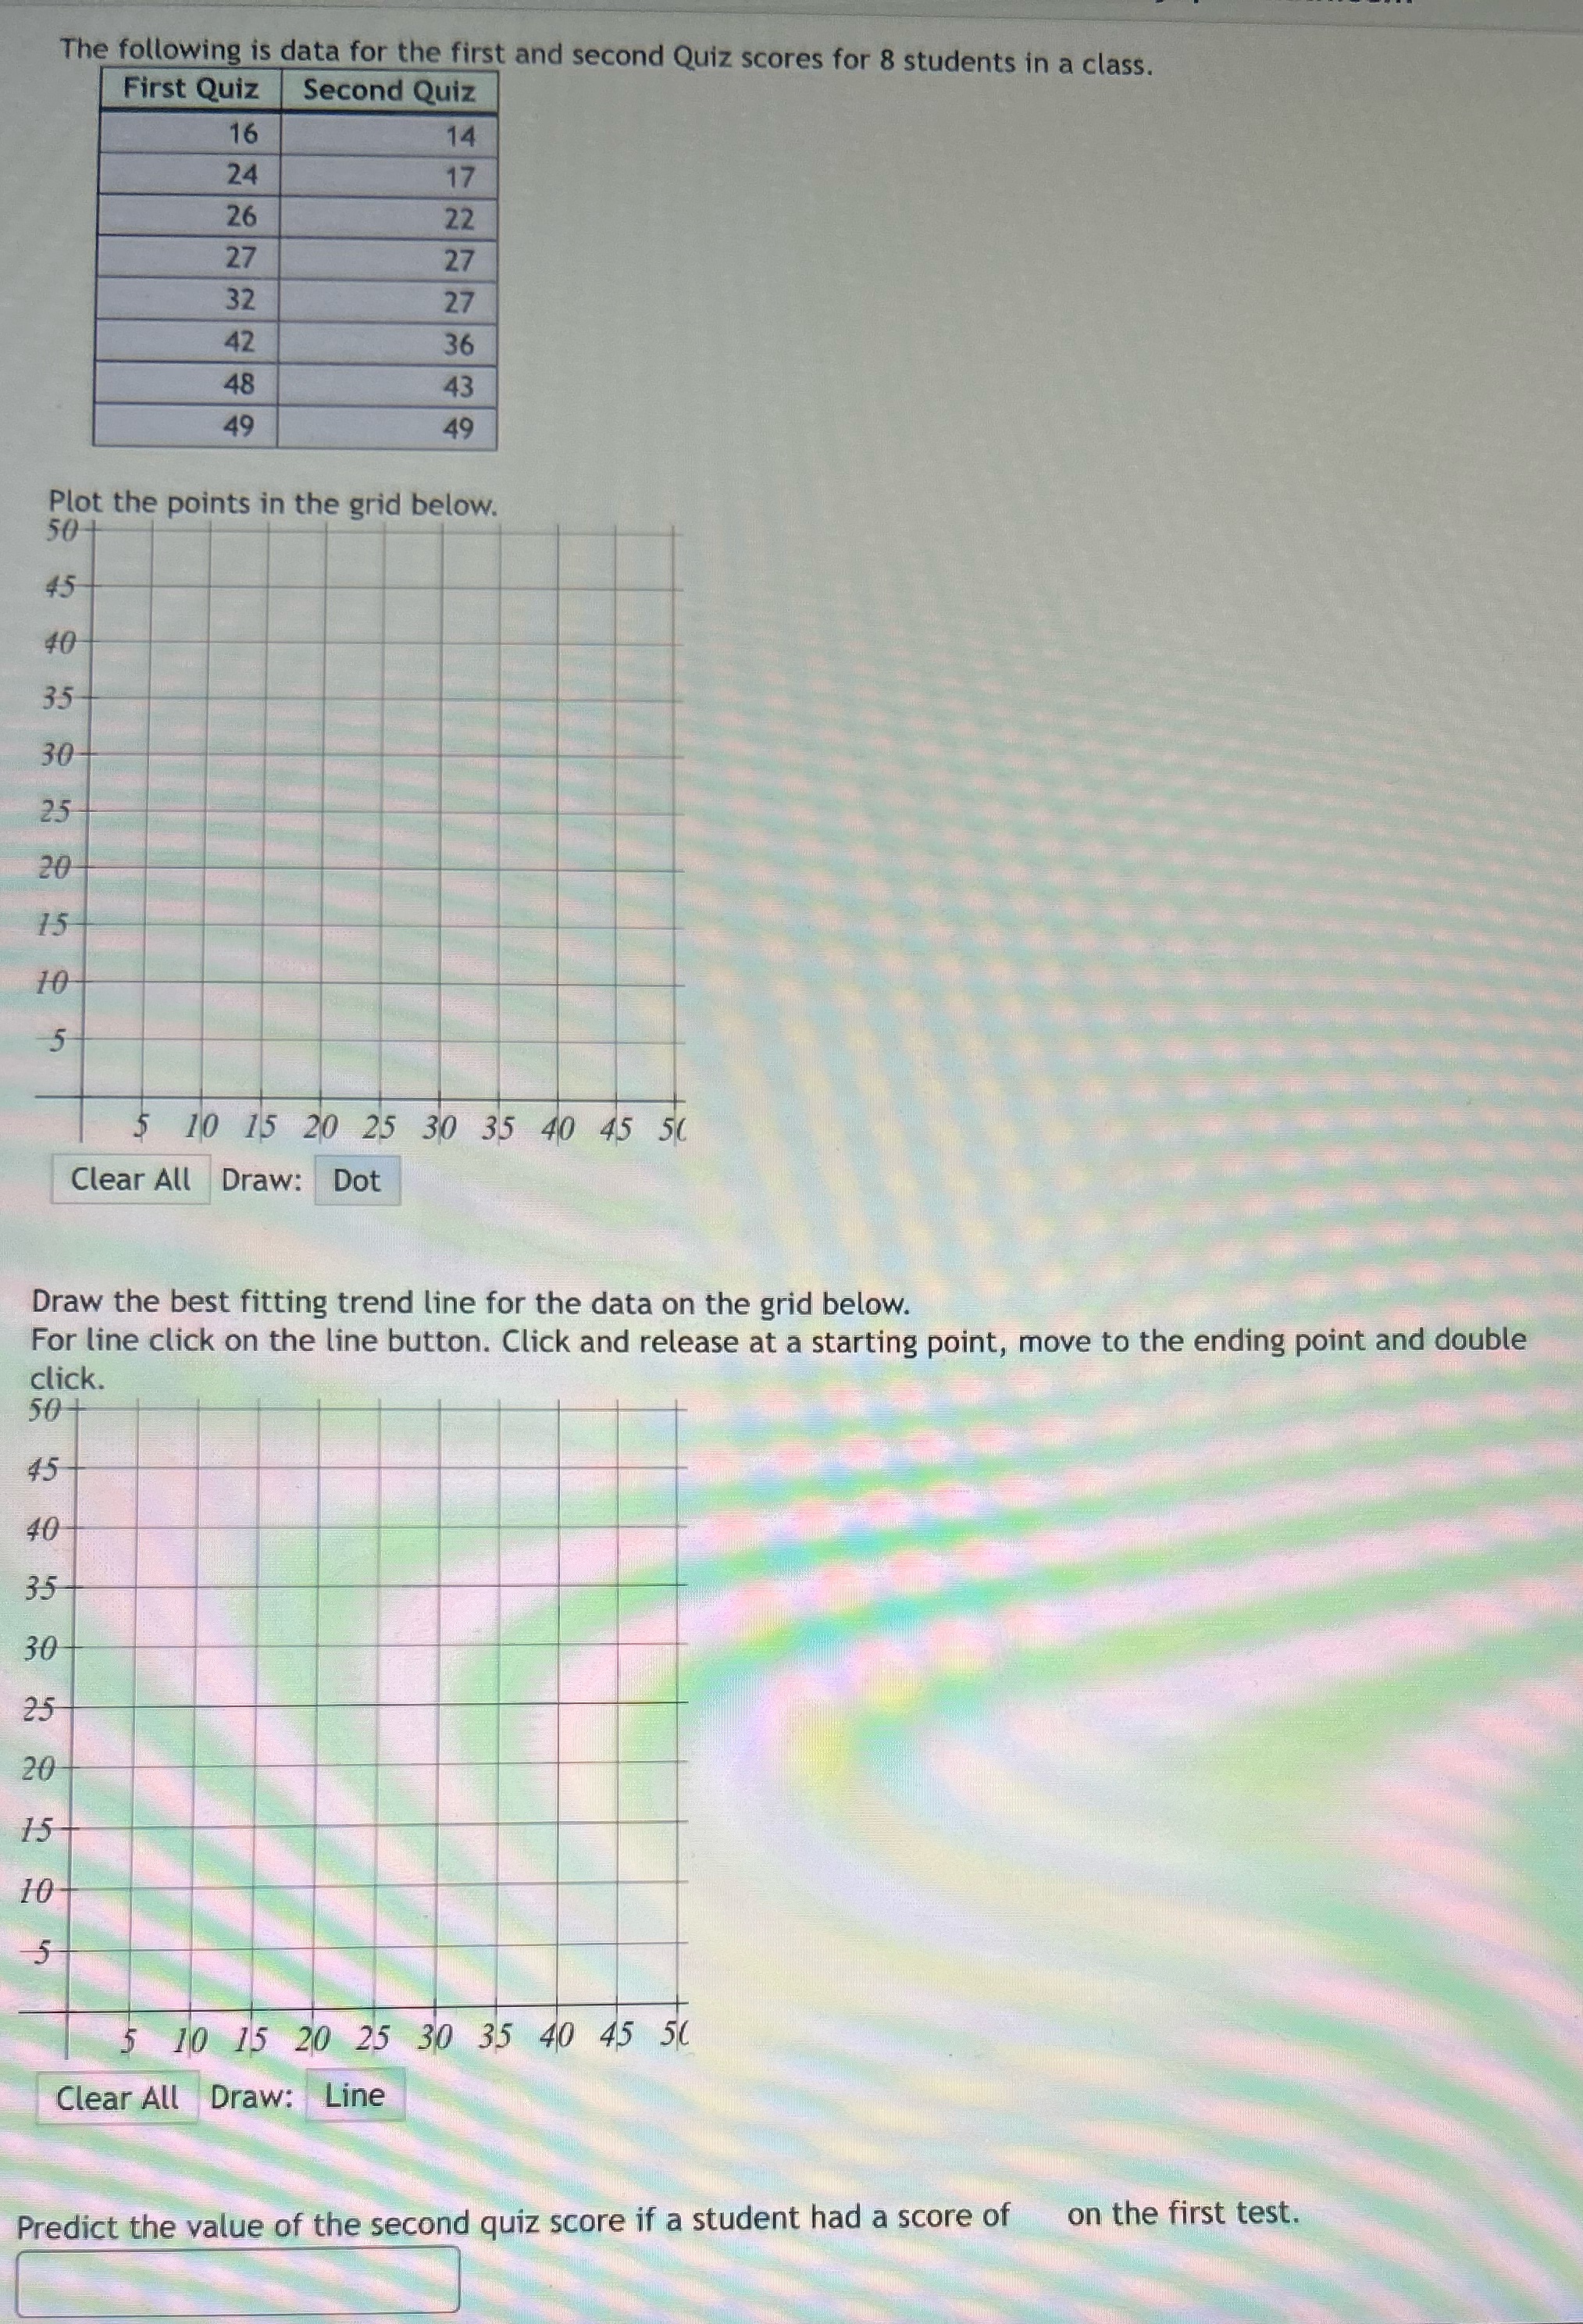
The following is data for the first and second Quiz scores for 8 students in a class. First Quiz Second Quiz 16 14 24 17 26 22 27 27 32 27 42 36 48 43 49 49 Plot the points in the grid below. 504 45 40 35 30 25 20 15 -5 $ 10 15 20 25 30 35 40 45 50 Clear All Draw: Dot Draw the best fitting trend line for the data on the grid below. For line click on the line button. Click and release at a starting point, move to the ending point and double click. 50+ 45 40 35 30 25 20 15 10 5 5 10 15 20 25 30 35 40 45 50 Clear All Draw: Line Predict the value of the second quiz score if a student had a score of on the first test
Step by Step Solution
There are 3 Steps involved in it

Get step-by-step solutions from verified subject matter experts