

Question: I know how to set the chart and how to get the top data information. X=2.46; UCL=3.08 and LCL=1.84. And R=.23, I need help figuring
I know how to set the chart and how to get the top data information. X=2.46; UCL=3.08 and LCL=1.84. And R=.23, I need help figuring out the highlighted UCL and LCL.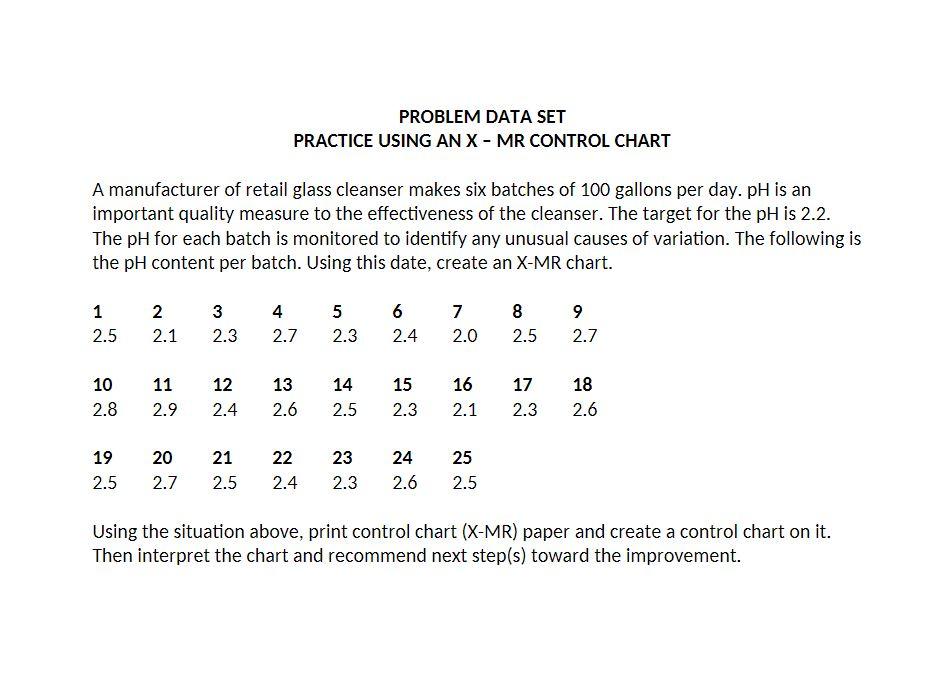
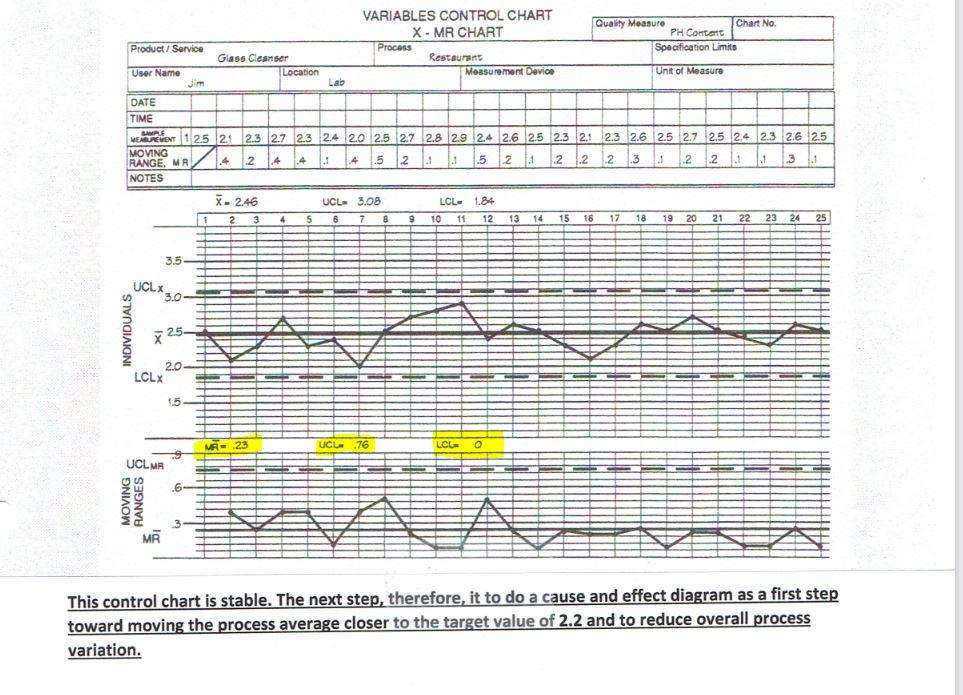
A manufacturer of retail glass cleanser makes six batches of 100 gallons per day. pH is an important quality measure to the effectiveness of the cleanser. The target for the pH is 2.2. The pH for each batch is monitored to identify any unusual causes of variation. The following is the pH content per batch. Using this date, create an X-MR chart. Using the situation above, print control chart (X-MR) paper and create a control chart on it. Then interpret the chart and recommend next step(s) toward the improvement. This control chart is stable. The next step, therefore, it to do a cause and effect diagram as a first step toward moving the process average closer to the target value of 2.2 and to reduce overall process variation
Step by Step Solution
There are 3 Steps involved in it
1 Expert Approved Answer
Step: 1 Unlock

Question Has Been Solved by an Expert!
Get step-by-step solutions from verified subject matter experts
Step: 2 Unlock
Step: 3 Unlock