

Question: I made the graph from the table, but I do not understand how to read it in order to answer questions 2 and 3 60000000
 I made the graph from the table, but I do not understand how to read it in order to answer questions 2 and 3
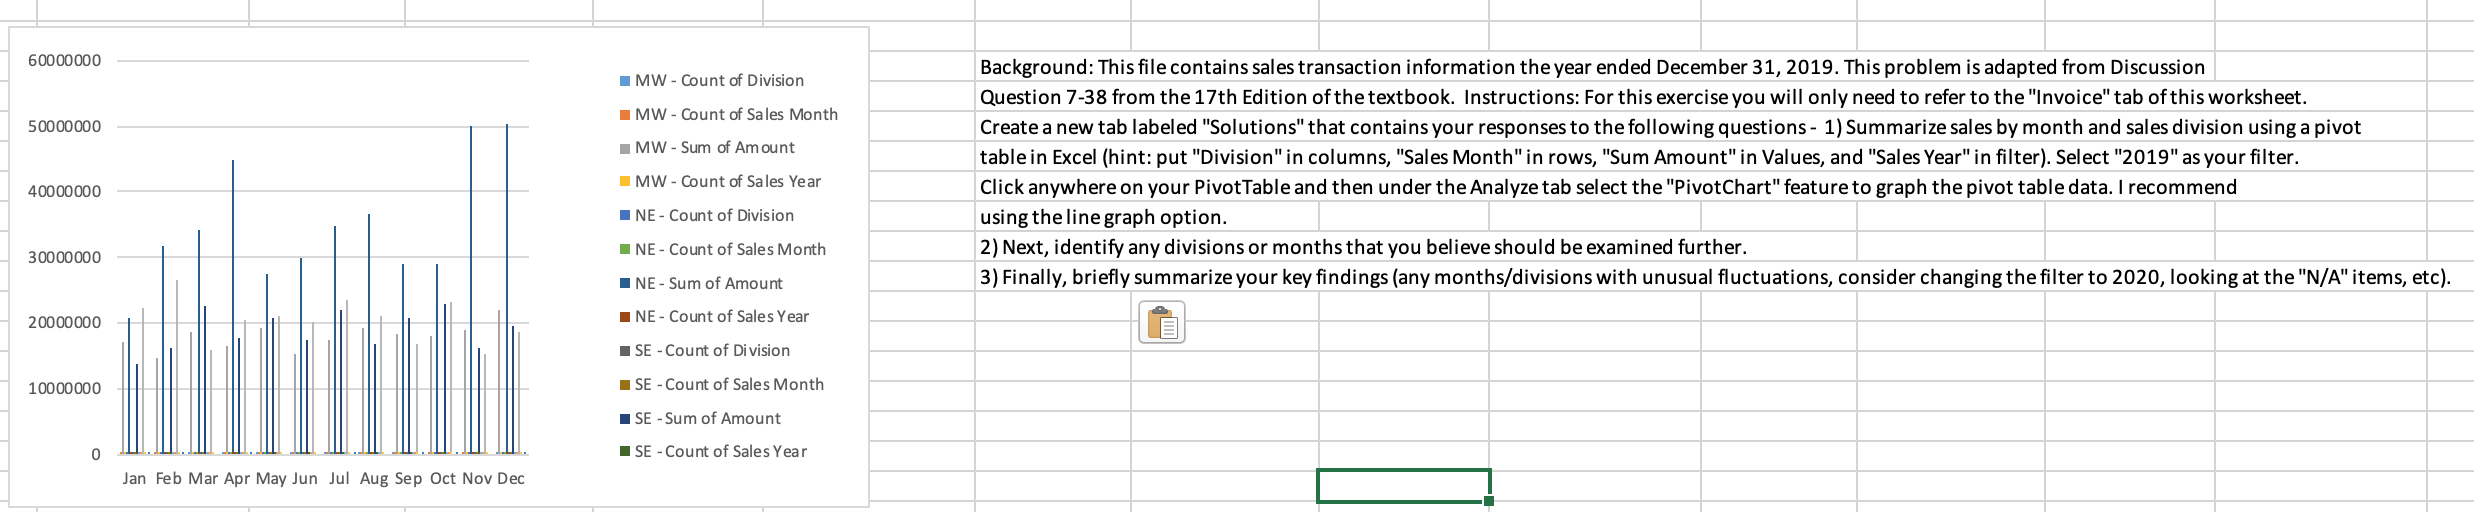
60000000 MW - Count of Division MW - Count of Sales Month 500 00 000 MW - Sum of Amount Background: This file contains sales transaction information the year ended December 31, 2019. This problem is adapted from Discussion Question 7-38 from the 17th Edition of the textbook. Instructions: For this exercise you will only need to refer to the "Invoice" tab of this worksheet. Create a new tab labeled "Solutions" that contains your responses to the following questions - 1) Summarize sales by month and sales division using a pivot table in Excel (hint: put "Division" in columns, "Sales Month" in rows, "Sum Amount" in Values, and "Sales Year" in filter). Select "2019" as your filter. Click anywhere on your Pivot Table and then under the Analyze tab select the "PivotChart" feature to graph the pivot table data. I recommend using the line graph option. 2) Next, identify any divisions or months that you believe should be examined further. 3) Finally, briefly summarize your key findings (any months/divisions with unusual fluctuations, consider changing the filter to 2020, looking at the "N/A"items, etc). 40000000 MW - Count of Sales Year NE - Count of Division 30000 000 NE - Count of Sales Month NE-Sum of Amount 20000000 10000000 NE - Count of Sales Year SE - Count of Division SE - Count of Sales Month SE - Sum of Amount SE - Count of Sales Year Jan Feb Mar Apr May Jun Jul Aug Sep Oct Nov Dec 60000000 MW - Count of Division MW - Count of Sales Month 500 00 000 MW - Sum of Amount Background: This file contains sales transaction information the year ended December 31, 2019. This problem is adapted from Discussion Question 7-38 from the 17th Edition of the textbook. Instructions: For this exercise you will only need to refer to the "Invoice" tab of this worksheet. Create a new tab labeled "Solutions" that contains your responses to the following questions - 1) Summarize sales by month and sales division using a pivot table in Excel (hint: put "Division" in columns, "Sales Month" in rows, "Sum Amount" in Values, and "Sales Year" in filter). Select "2019" as your filter. Click anywhere on your Pivot Table and then under the Analyze tab select the "PivotChart" feature to graph the pivot table data. I recommend using the line graph option. 2) Next, identify any divisions or months that you believe should be examined further. 3) Finally, briefly summarize your key findings (any months/divisions with unusual fluctuations, consider changing the filter to 2020, looking at the "N/A"items, etc). 40000000 MW - Count of Sales Year NE - Count of Division 30000 000 NE - Count of Sales Month NE-Sum of Amount 20000000 10000000 NE - Count of Sales Year SE - Count of Division SE - Count of Sales Month SE - Sum of Amount SE - Count of Sales Year Jan Feb Mar Apr May Jun Jul Aug Sep Oct Nov Dec
Step by Step Solution
There are 3 Steps involved in it

Get step-by-step solutions from verified subject matter experts