

Question: I mainly need help with the first excel sheet and making sure everything is right. Everything else would be greatly appreciated. TIA In November 2005,
I mainly need help with the first excel sheet and making sure everything is right. Everything else would be greatly appreciated. TIA
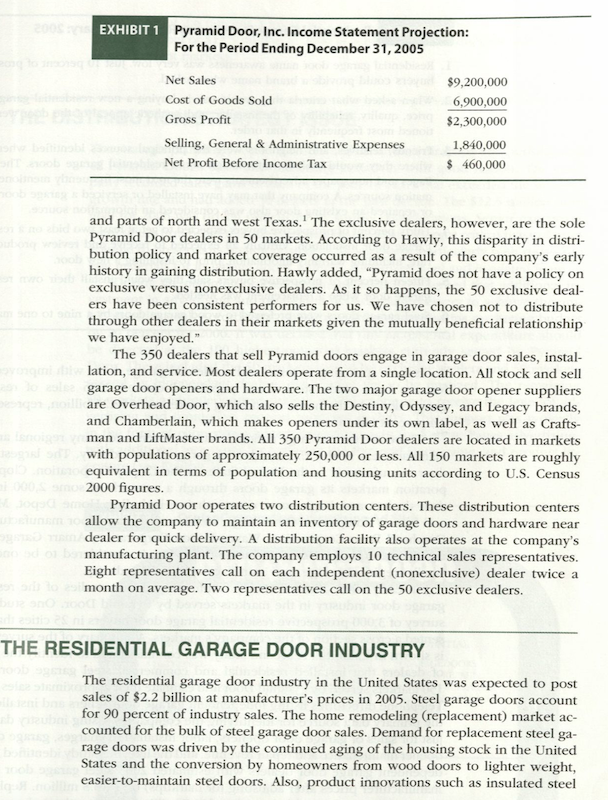
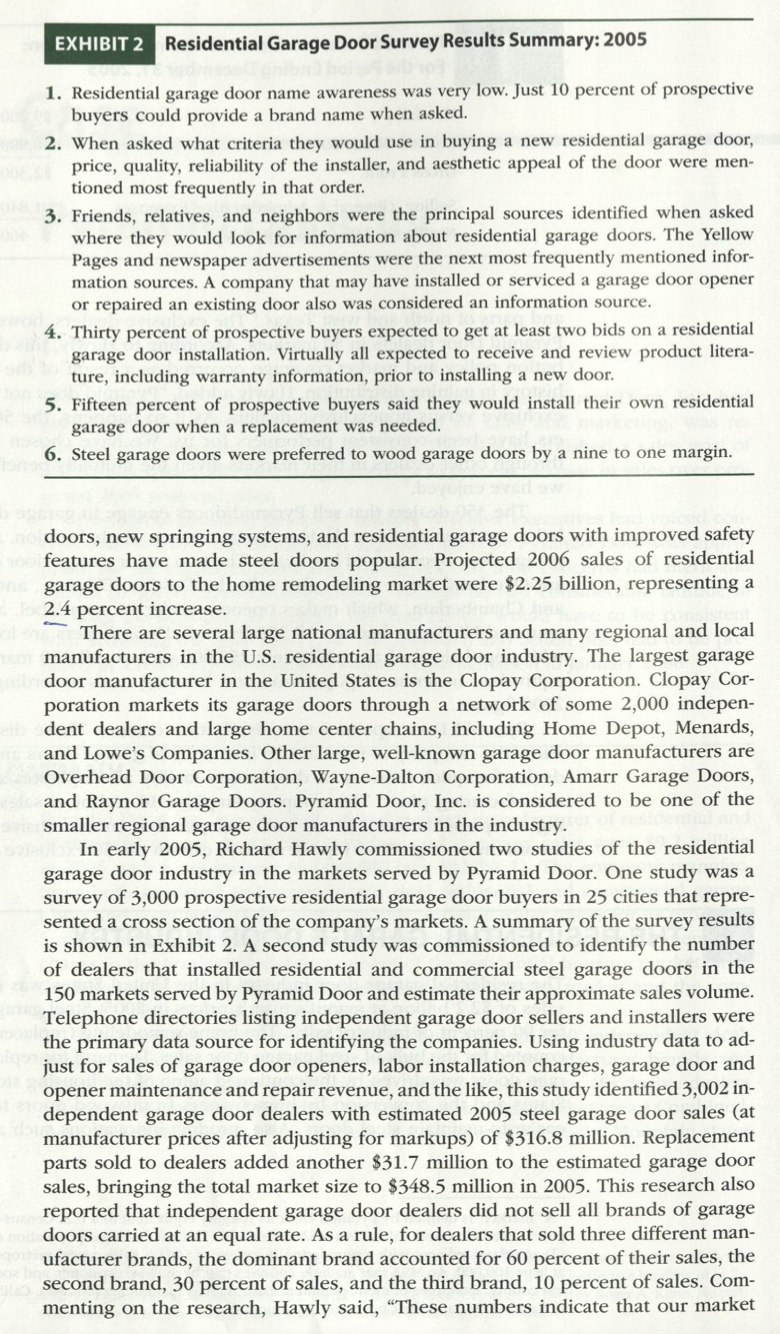
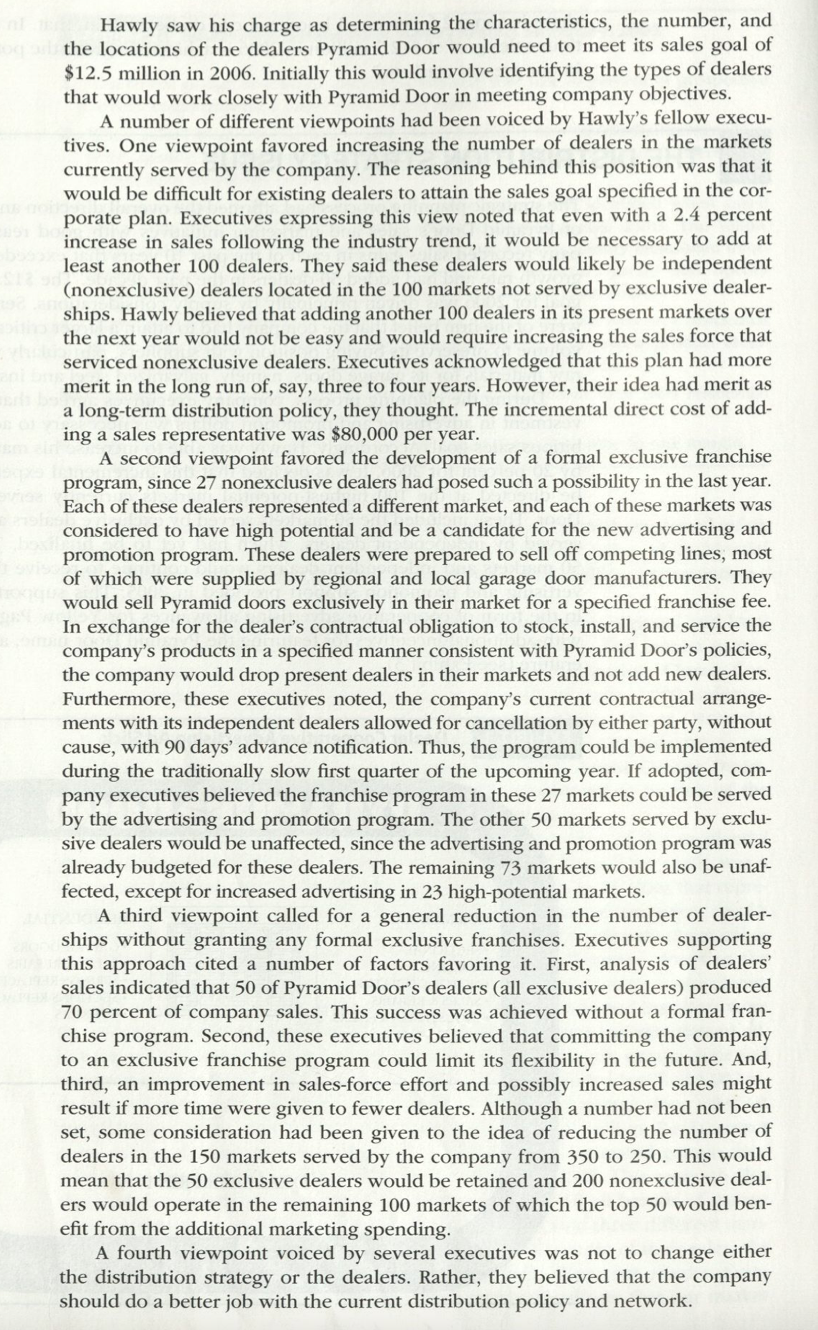
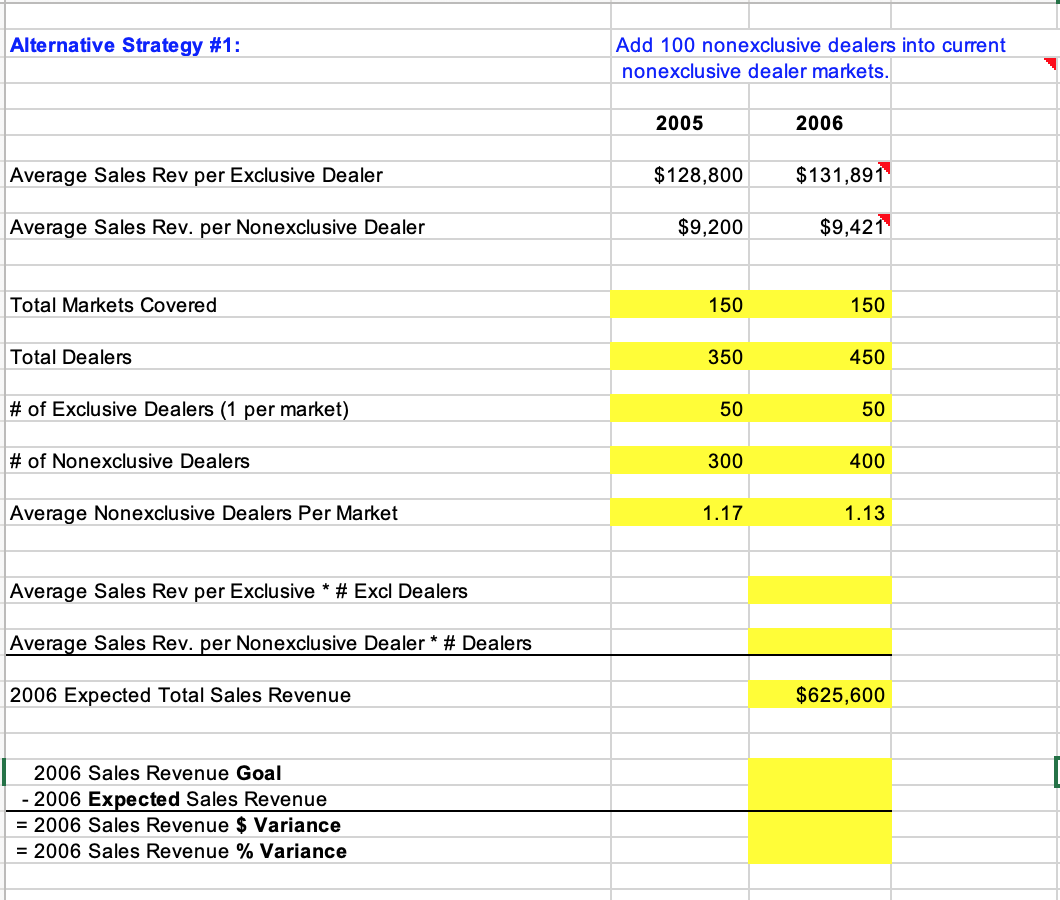
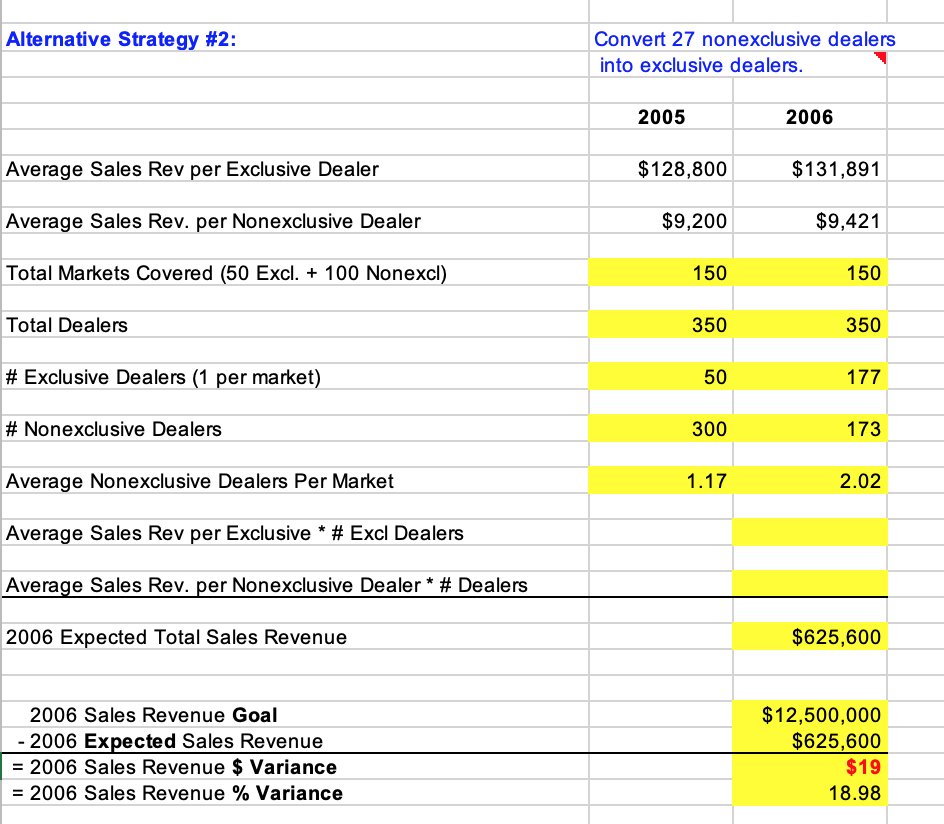
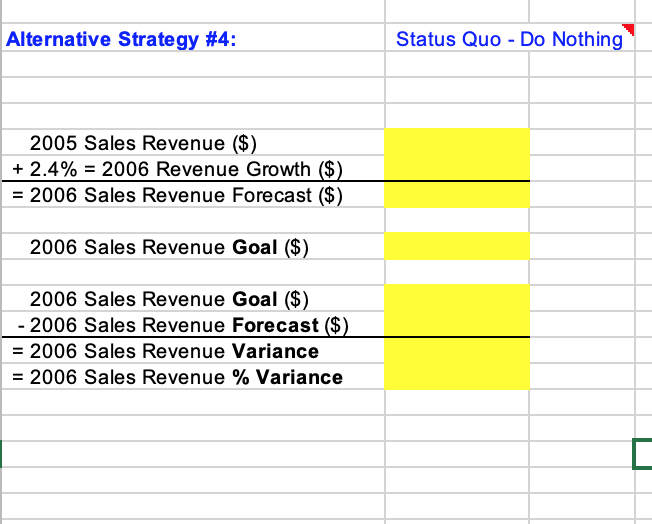
In November 2005, the company planning process for Pyramid Door, Inc. had just concluded, and Richard Hawly, director of sales and marketing, was re- viewing the corporate sales goal for 2006. The plan established a sales goal of $12.5 million for 2006, which represented a 36 percent increase in sales over pro- jected 2005 year-end sales. During the planning process, a number of fellow executives had voiced con- cern over whether the distribution approach used by Pyramid Door was appro- priate for the expanded sales goal. Hawly felt that their concerns had merit and should be given careful consideration. Though he had considerable latitude in devising the distribution strategy, the final choice would have to be consistent with achieving the 2006 sales goal. His approach and action plan had to be pre- pared in a relatively short time to permit implementation in January 2006. THE COMPANY Pyramid Door, Inc. is a privately owned regional manufacturer of residential and commercial garage doors. Projected year-end company sales were $9.2 million in 2005 with a net income of $460,000 (see Exhibit 1). The company manufac- tures both insulated and noninsulated steel residential and commercial garage doors and supplies springs, cables, rollers, and side roller tracks for its products. Surveys of its dealers indicate that the majority of its doors are replacement pur- chases in the home remodeling segment of the residential housing market, with the balance of sales going to the new residential housing market and the com- mercial replacement garage door market. The company distributes its garage doors through 300 independent deal- ers that typically offer three different garage door manufacturer brands and 50 exclusive dealers that stock and sell only Pyramid doors. (Exclusive dealers often service competing brands of garage doors in their market area.) Combined, these 350 dealers service 150 markets in 11 western and Rocky Mountain states EXHIBIT 1 Pyramid Door, Inc. Income Statement Projection: For the Period Ending December 31, 2005 Net Sales Cost of Goods Sold Gross Profit Selling, General & Administrative Expenses Net Profit Before Income Tax $9,200,000 6,900,000 $2,300,000 1,840,000 $ 460,000 and parts of north and west Texas. The exclusive dealers, however, are the sole Pyramid Door dealers in 50 markets. According to Hawly, this disparity in distri- bution policy and market coverage occurred as a result of the company's early history in gaining distribution. Hawly added, "Pyramid does not have a policy on exclusive versus nonexclusive dealers. As it so happens, the 50 exclusive deal- ers have been consistent performers for us. We have chosen not to distribute through other dealers in their markets given the mutually beneficial relationship we have enjoyed." The 350 dealers that sell Pyramid doors engage in garage door sales, instal- lation, and service. Most dealers operate from a single location. All stock and sell garage door openers and hardware. The two major garage door opener suppliers are Overhead Door, which also sells the Destiny, Odyssey, and Legacy brands, and Chamberlain, which makes openers under its own label, as well as Crafts- man and LiftMaster brands. All 350 Pyramid Door dealers are located in markets with populations of approximately 250,000 or less. All 150 markets are roughly equivalent in terms of population and housing units according to U.S. Census 2000 figures. Pyramid Door operates two distribution centers. These distribution centers allow the company to maintain an inventory of garage doors and hardware near dealer for quick delivery. A distribution facility also operates at the company's manufacturing plant. The company employs 10 technical sales representatives. Eight representatives call on each independent (nonexclusive) dealer twice a month on average. Two representatives call on the 50 exclusive dealers. THE RESIDENTIAL GARAGE DOOR INDUSTRY The residential garage door industry in the United States was expected to post sales of $2.2 billion at manufacturer's prices in 2005. Steel garage doors account for 90 percent of industry sales. The home remodeling (replacement) market ac- counted for the bulk of steel garage door sales. Demand for replacement steel ga- rage doors was driven by the continued aging of the housing stock in the United States and the conversion by homeowners from wood doors to lighter weight, easier-to-maintain steel doors. Also, product innovations such as insulated steel EXHIBIT 2 Residential Garage Door Survey Results Summary: 2005 1. Residential garage door name awareness was very low. Just 10 percent of prospective buyers could provide a brand name when asked. 2. When asked what criteria they would use in buying a new residential garage door, price, quality, reliability of the installer, and aesthetic appeal of the door were men- tioned most frequently in that order. 3. Friends, relatives, and neighbors were the principal sources identified when asked where they would look for information about residential garage doors. The Yellow Pages and newspaper advertisements were the next most frequently mentioned infor- mation sources. A company that may have installed or serviced a garage door opener or repaired an existing door also was considered an information source. 4. Thirty percent of prospective buyers expected to get at least two bids on a residential garage door installation. Virtually all expected to receive and review product litera- ture, including warranty information, prior to installing a new door. 5. Fifteen percent of prospective buyers said they would install their own residential garage door when a replacement was needed. 6. Steel garage doors were preferred to wood garage doors by a nine to one margin. doors, new springing systems, and residential garage doors with improved safety features have made steel doors popular. Projected 2006 sales of residential garage doors to the home remodeling market were $2.25 billion, representing a 2.4 percent increase. There are several large national manufacturers and many regional and local manufacturers in the U.S. residential garage door industry. The largest garage door manufacturer in the United States is the Clopay Corporation. Clopay Cor- poration markets its garage doors through a network of some 2,000 indepen- dent dealers and large home center chains, including Home Depot, Menards, and Lowe's Companies. Other large, well-known garage door manufacturers are Overhead Door Corporation, Wayne-Dalton Corporation, Amarr Garage Doors, and Raynor Garage Doors. Pyramid Door, Inc. is considered to be one of the smaller regional garage door manufacturers in the industry. In early 2005, Richard Hawly commissioned two studies of the residential garage door industry in the markets served by Pyram Door. One study was a survey of 3,000 prospective residential garage door buyers in 25 cities that repre- sented a cross section of the company's markets. A summary of the survey results is shown in Exhibit 2. A second study was commissioned to identify the number of dealers that installed residential and commercial steel garage doors in the 150 markets served by Pyramid Door and estimate their approximate sales volume. Telephone directories listing independent garage door sellers and installers were the primary data source for identifying the companies. Using industry data to ad- just for sales of garage door openers, labor installation charges, garage door and opener maintenance and repair revenue, and the like, this study identified 3,002 in- dependent garage door dealers with estimated 2005 steel garage door sales (at manufacturer prices after adjusting for markups) of $316.8 million. Replacement parts sold to dealers added another $31.7 million to the estimated garage door sales, bringing the total market size to $348.5 million in 2005. This research also reported that independent garage door dealers did not sell all brands of garage doors carried at an equal rate. As a rule, for dealers that sold three different man- ufacturer brands, the dominant brand accounted for 60 percent of their sales, the second brand, 30 percent of sales, and the third brand, 10 percent of sales. Com- menting on the research, Hawly said, These numbers indicate that our market per share is about 2.6 percent. I know we can do better than that. In fact, the ambi- Emptious sales goal of $12.5 million in 2006 is achievable given the potential existing in our present markets." THE DISTRIBUTION STRATEGY ISSUE The strategic planning process had affirmed the overall direction and performance of Pyramid Door's sales and marketing initiatives with good reason. The com- pany recorded sales gains in each of the past 10 years that exceeded the industry growth rate and had added 50 dealers in the past decade. The $12.5 million sales goal for 2006 was driven principally by supply considerations. Senior executives were of the firm belief that the company had to attain a larger critical mass of sales volume to preserve its buying position with suppliers, particularly with respect to raw materials for its garage doors, namely, galvanized steel and insulated foam. During the planning process, company executives agreed that additional in- vestment in advertising and promotion dollars was necessary to achieve the am- bitious sales goal. Accordingly, Hawly was able to increase his marketing budget by 20 percent for 2006. It was decided that this incremental expenditure should be directed at the 100 highest-potential markets currently served by Pyramid Door. These included the 50 markets served by exclusive dealers and 50 markets served by independent dealers, which had yet to be finalized. The remaining 50 markets and independent dealers would continue to receive the level of ad- vertising and promotion support provided in 2005. This support was typically in the form of cooperative advertising allowances for Yellow Pages advertising, with additional incentives for featuring the Pyramid Door name, and product lit- erature (see Exhibit 3). Hawly saw his charge as determining the characteristics, the number, and the locations of the dealers Pyramid Door would need to meet its sales goal of $12.5 million in 2006. Initially this would involve identifying the types of dealers that would work closely with Pyramid Door in meeting company objectives. A number of different viewpoints had been voiced by Hawly's fellow execu- tives. One viewpoint favored increasing the number of dealers in the markets currently served by the company. The reasoning behind this position was that it would be difficult for existing dealers to attain the sales goal specified in the cor- porate plan. Executives expressing this view noted that even with a 2.4 percent increase in sales following the industry trend, it would be necessary to add at least another 100 dealers. They said these dealers would likely be independent (nonexclusive) dealers located in the 100 markets not served by exclusive dealer- ships. Hawly believed that adding another 100 dealers in its present markets over the next year would not be easy and would require increasing the sales force that serviced nonexclusive dealers. Executives acknowledged that this plan had more merit in the long run of, say, three to four years. However, their idea had merit as a long-term distribution policy, they thought. The incremental direct cost of add- ing a sales representative was $80,000 per year. A second viewpoint favored the development of a formal exclusive franchise program, since 27 nonexclusive dealers had posed such a possibility in the last year. Each of these dealers represented a different market, and each of these markets was considered to have high potential and be a candidate for the new advertising and promotion program. These dealers were prepared to sell off competing lines, most of which were supplied by regional and local garage door manufacturers. They would sell Pyramid doors exclusively in their market for a specified franchise fee. In exchange for the dealer's contractual obligation to stock, install, and service the company's products in a specified manner consistent with Pyramid Door's policies, the company would drop present dealers in their markets and not add new dealers. Furthermore, these executives noted, the company's current contractual arrange- ments with its independent dealers allowed for cancellation by either party, without cause, with 90 days' advance notification. Thus, the program could be implemented during the traditionally slow first quarter of the upcoming year. If adopted, com- pany executives believed the franchise program in these 27 markets could be served by the advertising and promotion program. The other 50 markets served by exclu- sive dealers would be unaffected, since the advertising and promotion program was already budgeted for these dealers. The remaining 73 markets would also be unaf- fected, except for increased advertising in 23 high-potential markets. A third viewpoint called for a general reduction in the number of dealer- ships without granting any formal exclusive franchises. Executives supporting this approach cited a number of factors favoring it. First, analysis of dealers' sales indicated that 50 of Pyramid Door's dealers (all exclusive dealers) produced 70 percent of company sales. This success was achieved without a formal fran- chise program. Second, these executives believed that committing the company to an exclusive franchise program could limit its flexibility in the future. And, third, an improvement in sales-force effort and possibly increased sales might result if more time were given to fewer dealers. Although a number had not been set, some consideration had been given to the idea of reducing the number of dealers in the 150 markets served by the company from 350 to 250. This would mean that the 50 exclusive dealers would be retained and 200 nonexclusive deal- ers would operate in the remaining 100 markets of which the top 50 would ben- efit from the additional marketing spending. A fourth viewpoint voiced by several executives was not to change either the distribution strategy or the dealers. Rather, they believed that the company should do a better job with the current distribution policy and network. Alternative Strategy #1: Add 100 nonexclusive dealers into current nonexclusive dealer markets. 2005 2006 Average Sales Rev per Exclusive Dealer $128,800 $131,891 Average Sales Rev. per Nonexclusive Dealer $9,200 $9,421 Total Markets Covered 150 150 Total Dealers 350 450 # of Exclusive Dealers (1 per market) 50 50 # of Nonexclusive Dealers 300 400 Average Nonexclusive Dealers Per Market 1.17 1.13 Average Sales Rev per Exclusive * # Excl Dealers Average Sales Rev. per Nonexclusive Dealer * # Dealers 2006 Expected Total Sales Revenue $625,600 2006 Sales Revenue Goal - 2006 Expected Sales Revenue = 2006 Sales Revenue $ Variance = 2006 Sales Revenue % Variance Alternative Strategy #2: Convert 27 nonexclusive dealers into exclusive dealers. 2005 2006 Average Sales Rev per Exclusive Dealer $128,800 $131,891 Average Sales Rev. per Nonexclusive Dealer $9,200 $9,421 Total Markets Covered (50 Excl. + 100 Nonexcl) 150 150 Total Dealers 350 350 # Exclusive Dealers (1 per market) 50 177 # Nonexclusive Dealers 300 173 Average Nonexclusive Dealers Per Market 1.17 2.02 Average Sales Rev per Exclusive * # Excl Dealers Average Sales Rev. per Nonexclusive Dealer * # Dealers 2006 Expected Total Sales Revenue $625,600 2006 Sales Revenue Goal - 2006 Expected Sales Revenue = 2006 Sales Revenue $ Variance = 2006 Sales Revenue % Variance $12,500,000 $625,600 $19 18.98 Alternative Strategy #3: Reduce nonexclusive dealers by 100 dealers. 2005 2006 Average Sales Rev per Exclusive Dealer $128,800 $131,891 Average Sales Rev. per Nonexclusive Dealer $9,200 $9,421 Total Markets Covered 150 150 Total Dealers 350 # Exclusive Dealers (1 per market) 50 # Nonexclusive Dealers 300 Average Nonexclusive Dealers Per Market 1.17 Average Sales Rev per Exclusive * # Excl Dealers Average Sales Rev. per Nonexclusive Dealer * # Dealers 2006 Expected Total Sales Revenue $625,600 2006 Sales Revenue Goal - 2006 Expected Sales Revenue = 2006 Sales Revenue Variance = 2006 Sales Revenue % Variance $12,500,000 $625,600 $19 18.98 Alternative Strategy #4: Status Quo - Do Nothing 2005 Sales Revenue ($) + 2.4% = 2006 Revenue Growth ($) = 2006 Sales Revenue Forecast ($) 2006 Sales Revenue Goal ($) 2006 Sales Revenue Goal ($) - 2006 Sales Revenue Forecast ($) = 2006 Sales Revenue Variance = 2006 Sales Revenue % Variance In November 2005, the company planning process for Pyramid Door, Inc. had just concluded, and Richard Hawly, director of sales and marketing, was re- viewing the corporate sales goal for 2006. The plan established a sales goal of $12.5 million for 2006, which represented a 36 percent increase in sales over pro- jected 2005 year-end sales. During the planning process, a number of fellow executives had voiced con- cern over whether the distribution approach used by Pyramid Door was appro- priate for the expanded sales goal. Hawly felt that their concerns had merit and should be given careful consideration. Though he had considerable latitude in devising the distribution strategy, the final choice would have to be consistent with achieving the 2006 sales goal. His approach and action plan had to be pre- pared in a relatively short time to permit implementation in January 2006. THE COMPANY Pyramid Door, Inc. is a privately owned regional manufacturer of residential and commercial garage doors. Projected year-end company sales were $9.2 million in 2005 with a net income of $460,000 (see Exhibit 1). The company manufac- tures both insulated and noninsulated steel residential and commercial garage doors and supplies springs, cables, rollers, and side roller tracks for its products. Surveys of its dealers indicate that the majority of its doors are replacement pur- chases in the home remodeling segment of the residential housing market, with the balance of sales going to the new residential housing market and the com- mercial replacement garage door market. The company distributes its garage doors through 300 independent deal- ers that typically offer three different garage door manufacturer brands and 50 exclusive dealers that stock and sell only Pyramid doors. (Exclusive dealers often service competing brands of garage doors in their market area.) Combined, these 350 dealers service 150 markets in 11 western and Rocky Mountain states EXHIBIT 1 Pyramid Door, Inc. Income Statement Projection: For the Period Ending December 31, 2005 Net Sales Cost of Goods Sold Gross Profit Selling, General & Administrative Expenses Net Profit Before Income Tax $9,200,000 6,900,000 $2,300,000 1,840,000 $ 460,000 and parts of north and west Texas. The exclusive dealers, however, are the sole Pyramid Door dealers in 50 markets. According to Hawly, this disparity in distri- bution policy and market coverage occurred as a result of the company's early history in gaining distribution. Hawly added, "Pyramid does not have a policy on exclusive versus nonexclusive dealers. As it so happens, the 50 exclusive deal- ers have been consistent performers for us. We have chosen not to distribute through other dealers in their markets given the mutually beneficial relationship we have enjoyed." The 350 dealers that sell Pyramid doors engage in garage door sales, instal- lation, and service. Most dealers operate from a single location. All stock and sell garage door openers and hardware. The two major garage door opener suppliers are Overhead Door, which also sells the Destiny, Odyssey, and Legacy brands, and Chamberlain, which makes openers under its own label, as well as Crafts- man and LiftMaster brands. All 350 Pyramid Door dealers are located in markets with populations of approximately 250,000 or less. All 150 markets are roughly equivalent in terms of population and housing units according to U.S. Census 2000 figures. Pyramid Door operates two distribution centers. These distribution centers allow the company to maintain an inventory of garage doors and hardware near dealer for quick delivery. A distribution facility also operates at the company's manufacturing plant. The company employs 10 technical sales representatives. Eight representatives call on each independent (nonexclusive) dealer twice a month on average. Two representatives call on the 50 exclusive dealers. THE RESIDENTIAL GARAGE DOOR INDUSTRY The residential garage door industry in the United States was expected to post sales of $2.2 billion at manufacturer's prices in 2005. Steel garage doors account for 90 percent of industry sales. The home remodeling (replacement) market ac- counted for the bulk of steel garage door sales. Demand for replacement steel ga- rage doors was driven by the continued aging of the housing stock in the United States and the conversion by homeowners from wood doors to lighter weight, easier-to-maintain steel doors. Also, product innovations such as insulated steel EXHIBIT 2 Residential Garage Door Survey Results Summary: 2005 1. Residential garage door name awareness was very low. Just 10 percent of prospective buyers could provide a brand name when asked. 2. When asked what criteria they would use in buying a new residential garage door, price, quality, reliability of the installer, and aesthetic appeal of the door were men- tioned most frequently in that order. 3. Friends, relatives, and neighbors were the principal sources identified when asked where they would look for information about residential garage doors. The Yellow Pages and newspaper advertisements were the next most frequently mentioned infor- mation sources. A company that may have installed or serviced a garage door opener or repaired an existing door also was considered an information source. 4. Thirty percent of prospective buyers expected to get at least two bids on a residential garage door installation. Virtually all expected to receive and review product litera- ture, including warranty information, prior to installing a new door. 5. Fifteen percent of prospective buyers said they would install their own residential garage door when a replacement was needed. 6. Steel garage doors were preferred to wood garage doors by a nine to one margin. doors, new springing systems, and residential garage doors with improved safety features have made steel doors popular. Projected 2006 sales of residential garage doors to the home remodeling market were $2.25 billion, representing a 2.4 percent increase. There are several large national manufacturers and many regional and local manufacturers in the U.S. residential garage door industry. The largest garage door manufacturer in the United States is the Clopay Corporation. Clopay Cor- poration markets its garage doors through a network of some 2,000 indepen- dent dealers and large home center chains, including Home Depot, Menards, and Lowe's Companies. Other large, well-known garage door manufacturers are Overhead Door Corporation, Wayne-Dalton Corporation, Amarr Garage Doors, and Raynor Garage Doors. Pyramid Door, Inc. is considered to be one of the smaller regional garage door manufacturers in the industry. In early 2005, Richard Hawly commissioned two studies of the residential garage door industry in the markets served by Pyram Door. One study was a survey of 3,000 prospective residential garage door buyers in 25 cities that repre- sented a cross section of the company's markets. A summary of the survey results is shown in Exhibit 2. A second study was commissioned to identify the number of dealers that installed residential and commercial steel garage doors in the 150 markets served by Pyramid Door and estimate their approximate sales volume. Telephone directories listing independent garage door sellers and installers were the primary data source for identifying the companies. Using industry data to ad- just for sales of garage door openers, labor installation charges, garage door and opener maintenance and repair revenue, and the like, this study identified 3,002 in- dependent garage door dealers with estimated 2005 steel garage door sales (at manufacturer prices after adjusting for markups) of $316.8 million. Replacement parts sold to dealers added another $31.7 million to the estimated garage door sales, bringing the total market size to $348.5 million in 2005. This research also reported that independent garage door dealers did not sell all brands of garage doors carried at an equal rate. As a rule, for dealers that sold three different man- ufacturer brands, the dominant brand accounted for 60 percent of their sales, the second brand, 30 percent of sales, and the third brand, 10 percent of sales. Com- menting on the research, Hawly said, These numbers indicate that our market per share is about 2.6 percent. I know we can do better than that. In fact, the ambi- Emptious sales goal of $12.5 million in 2006 is achievable given the potential existing in our present markets." THE DISTRIBUTION STRATEGY ISSUE The strategic planning process had affirmed the overall direction and performance of Pyramid Door's sales and marketing initiatives with good reason. The com- pany recorded sales gains in each of the past 10 years that exceeded the industry growth rate and had added 50 dealers in the past decade. The $12.5 million sales goal for 2006 was driven principally by supply considerations. Senior executives were of the firm belief that the company had to attain a larger critical mass of sales volume to preserve its buying position with suppliers, particularly with respect to raw materials for its garage doors, namely, galvanized steel and insulated foam. During the planning process, company executives agreed that additional in- vestment in advertising and promotion dollars was necessary to achieve the am- bitious sales goal. Accordingly, Hawly was able to increase his marketing budget by 20 percent for 2006. It was decided that this incremental expenditure should be directed at the 100 highest-potential markets currently served by Pyramid Door. These included the 50 markets served by exclusive dealers and 50 markets served by independent dealers, which had yet to be finalized. The remaining 50 markets and independent dealers would continue to receive the level of ad- vertising and promotion support provided in 2005. This support was typically in the form of cooperative advertising allowances for Yellow Pages advertising, with additional incentives for featuring the Pyramid Door name, and product lit- erature (see Exhibit 3). Hawly saw his charge as determining the characteristics, the number, and the locations of the dealers Pyramid Door would need to meet its sales goal of $12.5 million in 2006. Initially this would involve identifying the types of dealers that would work closely with Pyramid Door in meeting company objectives. A number of different viewpoints had been voiced by Hawly's fellow execu- tives. One viewpoint favored increasing the number of dealers in the markets currently served by the company. The reasoning behind this position was that it would be difficult for existing dealers to attain the sales goal specified in the cor- porate plan. Executives expressing this view noted that even with a 2.4 percent increase in sales following the industry trend, it would be necessary to add at least another 100 dealers. They said these dealers would likely be independent (nonexclusive) dealers located in the 100 markets not served by exclusive dealer- ships. Hawly believed that adding another 100 dealers in its present markets over the next year would not be easy and would require increasing the sales force that serviced nonexclusive dealers. Executives acknowledged that this plan had more merit in the long run of, say, three to four years. However, their idea had merit as a long-term distribution policy, they thought. The incremental direct cost of add- ing a sales representative was $80,000 per year. A second viewpoint favored the development of a formal exclusive franchise program, since 27 nonexclusive dealers had posed such a possibility in the last year. Each of these dealers represented a different market, and each of these markets was considered to have high potential and be a candidate for the new advertising and promotion program. These dealers were prepared to sell off competing lines, most of which were supplied by regional and local garage door manufacturers. They would sell Pyramid doors exclusively in their market for a specified franchise fee. In exchange for the dealer's contractual obligation to stock, install, and service the company's products in a specified manner consistent with Pyramid Door's policies, the company would drop present dealers in their markets and not add new dealers. Furthermore, these executives noted, the company's current contractual arrange- ments with its independent dealers allowed for cancellation by either party, without cause, with 90 days' advance notification. Thus, the program could be implemented during the traditionally slow first quarter of the upcoming year. If adopted, com- pany executives believed the franchise program in these 27 markets could be served by the advertising and promotion program. The other 50 markets served by exclu- sive dealers would be unaffected, since the advertising and promotion program was already budgeted for these dealers. The remaining 73 markets would also be unaf- fected, except for increased advertising in 23 high-potential markets. A third viewpoint called for a general reduction in the number of dealer- ships without granting any formal exclusive franchises. Executives supporting this approach cited a number of factors favoring it. First, analysis of dealers' sales indicated that 50 of Pyramid Door's dealers (all exclusive dealers) produced 70 percent of company sales. This success was achieved without a formal fran- chise program. Second, these executives believed that committing the company to an exclusive franchise program could limit its flexibility in the future. And, third, an improvement in sales-force effort and possibly increased sales might result if more time were given to fewer dealers. Although a number had not been set, some consideration had been given to the idea of reducing the number of dealers in the 150 markets served by the company from 350 to 250. This would mean that the 50 exclusive dealers would be retained and 200 nonexclusive deal- ers would operate in the remaining 100 markets of which the top 50 would ben- efit from the additional marketing spending. A fourth viewpoint voiced by several executives was not to change either the distribution strategy or the dealers. Rather, they believed that the company should do a better job with the current distribution policy and network. Alternative Strategy #1: Add 100 nonexclusive dealers into current nonexclusive dealer markets. 2005 2006 Average Sales Rev per Exclusive Dealer $128,800 $131,891 Average Sales Rev. per Nonexclusive Dealer $9,200 $9,421 Total Markets Covered 150 150 Total Dealers 350 450 # of Exclusive Dealers (1 per market) 50 50 # of Nonexclusive Dealers 300 400 Average Nonexclusive Dealers Per Market 1.17 1.13 Average Sales Rev per Exclusive * # Excl Dealers Average Sales Rev. per Nonexclusive Dealer * # Dealers 2006 Expected Total Sales Revenue $625,600 2006 Sales Revenue Goal - 2006 Expected Sales Revenue = 2006 Sales Revenue $ Variance = 2006 Sales Revenue % Variance Alternative Strategy #2: Convert 27 nonexclusive dealers into exclusive dealers. 2005 2006 Average Sales Rev per Exclusive Dealer $128,800 $131,891 Average Sales Rev. per Nonexclusive Dealer $9,200 $9,421 Total Markets Covered (50 Excl. + 100 Nonexcl) 150 150 Total Dealers 350 350 # Exclusive Dealers (1 per market) 50 177 # Nonexclusive Dealers 300 173 Average Nonexclusive Dealers Per Market 1.17 2.02 Average Sales Rev per Exclusive * # Excl Dealers Average Sales Rev. per Nonexclusive Dealer * # Dealers 2006 Expected Total Sales Revenue $625,600 2006 Sales Revenue Goal - 2006 Expected Sales Revenue = 2006 Sales Revenue $ Variance = 2006 Sales Revenue % Variance $12,500,000 $625,600 $19 18.98 Alternative Strategy #3: Reduce nonexclusive dealers by 100 dealers. 2005 2006 Average Sales Rev per Exclusive Dealer $128,800 $131,891 Average Sales Rev. per Nonexclusive Dealer $9,200 $9,421 Total Markets Covered 150 150 Total Dealers 350 # Exclusive Dealers (1 per market) 50 # Nonexclusive Dealers 300 Average Nonexclusive Dealers Per Market 1.17 Average Sales Rev per Exclusive * # Excl Dealers Average Sales Rev. per Nonexclusive Dealer * # Dealers 2006 Expected Total Sales Revenue $625,600 2006 Sales Revenue Goal - 2006 Expected Sales Revenue = 2006 Sales Revenue Variance = 2006 Sales Revenue % Variance $12,500,000 $625,600 $19 18.98 Alternative Strategy #4: Status Quo - Do Nothing 2005 Sales Revenue ($) + 2.4% = 2006 Revenue Growth ($) = 2006 Sales Revenue Forecast ($) 2006 Sales Revenue Goal ($) 2006 Sales Revenue Goal ($) - 2006 Sales Revenue Forecast ($) = 2006 Sales Revenue Variance = 2006 Sales Revenue % Variance
Step by Step Solution
There are 3 Steps involved in it

Get step-by-step solutions from verified subject matter experts