

Question: I mainly need help with the graphing part K Quantity of Output Total Cost 0 $12 $14 N $18 $24 $32 5 $42 $54 7
I mainly need help with the graphing part
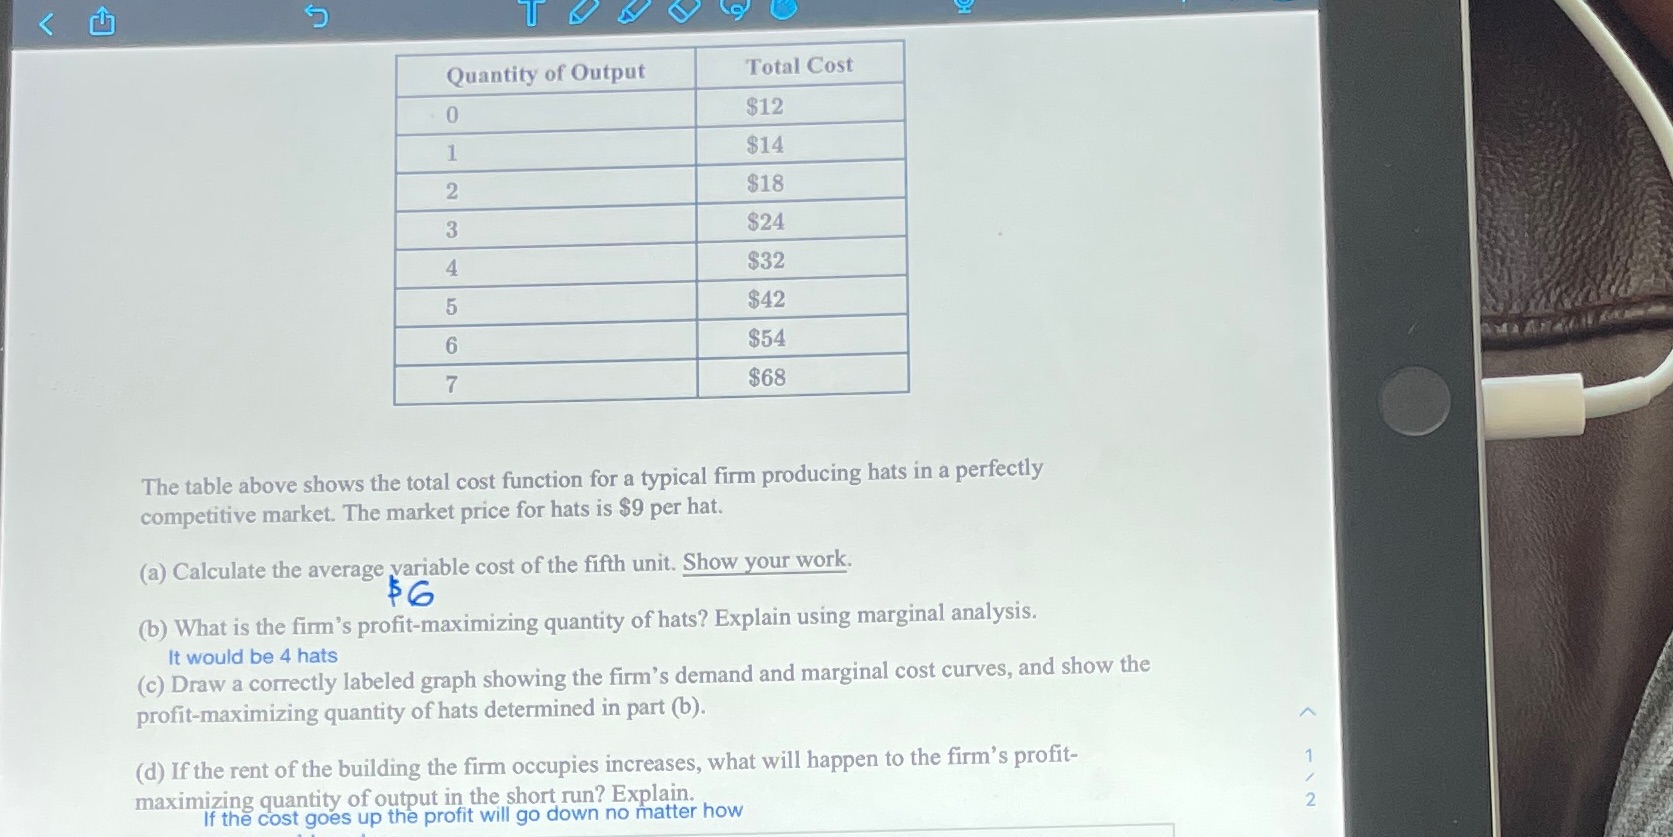
K Quantity of Output Total Cost 0 $12 $14 N $18 $24 $32 5 $42 $54 7 $68 The table above shows the total cost function for a typical firm producing hats in a perfectly competitive market. The market price for hats is $9 per hat. (a) Calculate the average variable cost of the fifth unit. Show your work. $6 (b) What is the firm's profit-maximizing quantity of hats? Explain using marginal analysis. It would be 4 hats (c) Draw a correctly labeled graph showing the firm's demand and marginal cost curves, and show the profit-maximizing quantity of hats determined in part (b). (d) If the rent of the building the firm occupies increases, what will happen to the firm's profit- N I - maximizing quantity of output in the short run? Explain. If the cost goes up the profit will go down no matter how
Step by Step Solution
There are 3 Steps involved in it

Get step-by-step solutions from verified subject matter experts