

Question: I need a full solution including working outs, and excel formulas and graphs and t distribution with labelled Habitat Thickness (mm) of shells of the
I need a full solution including working outs, and excel formulas and graphs and t distribution with labelled
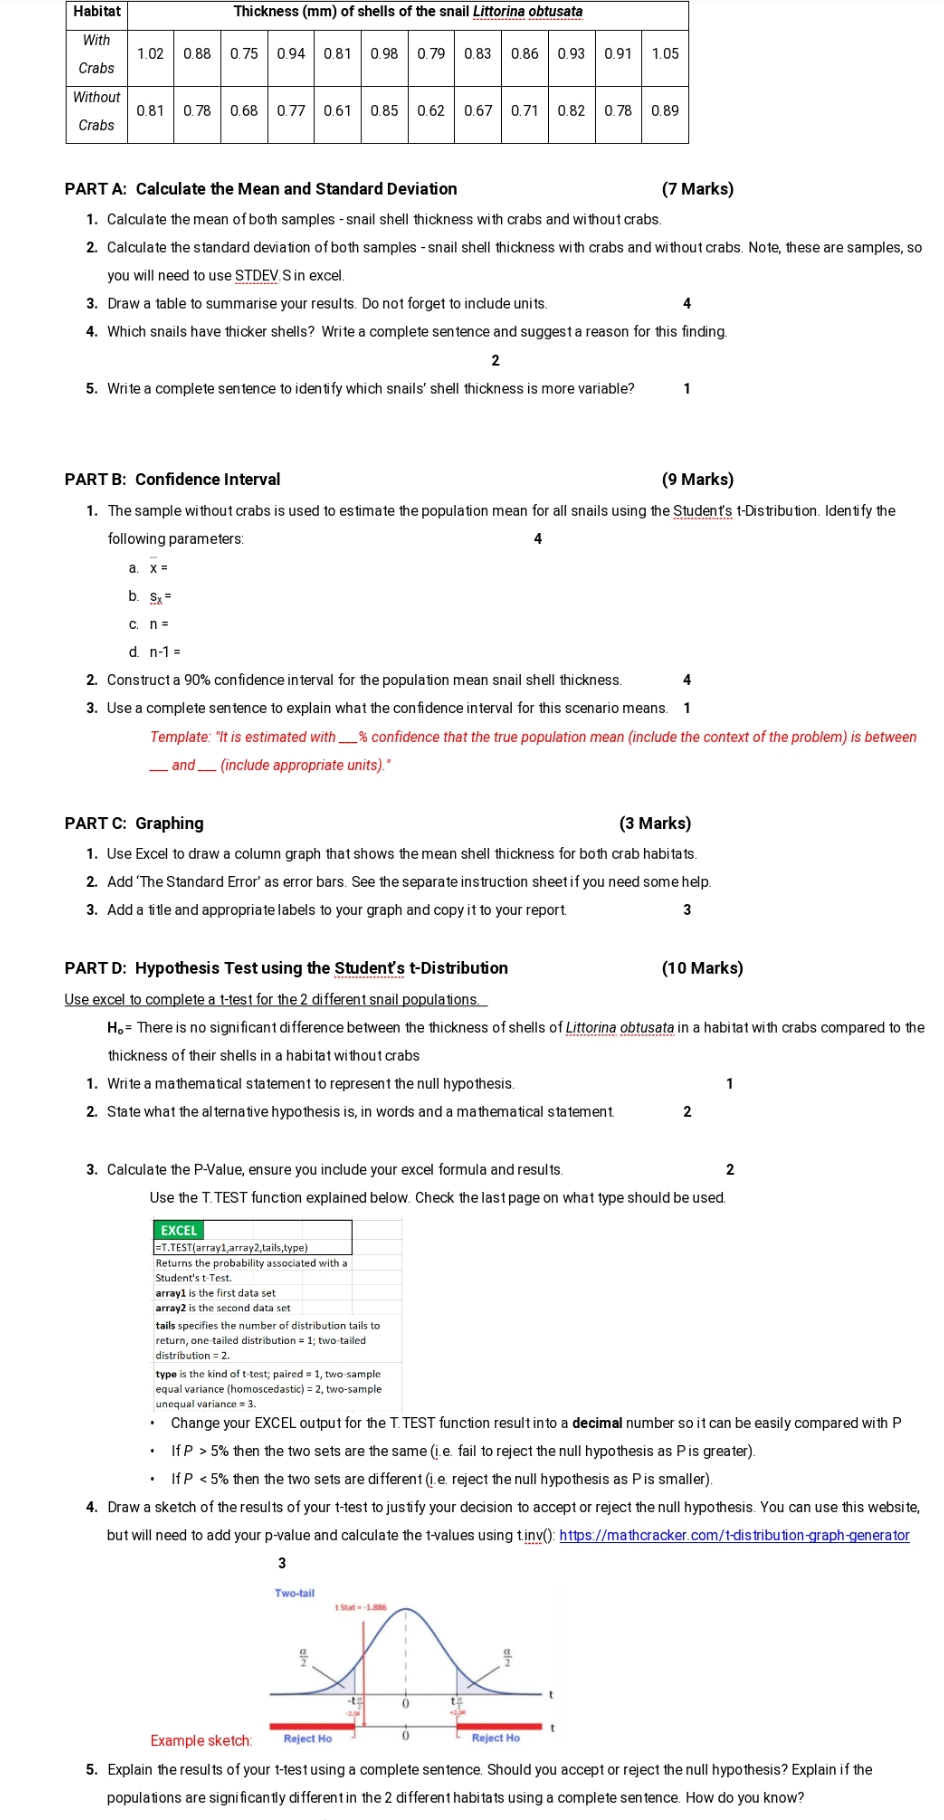
Habitat Thickness (mm) of shells of the snail Littorina obtusata With 1.02 0.88 0. 75 0.94 0.81 0.98 0. 79 0.83 0.86 0.93 0.91 1.05 Crabs Without 0.81 0. 78 0.68 0.77 0.61 0.85 | 0.62 0.67 |0.71 0.82 0.78 0.89 Crabs PART A: Calculate the Mean and Standard Deviation (7 Marks) 1. Calculate the mean of both samples - snail shell thickness with crabs and without crabs. 2. Calculate the standard deviation of both samples - snail shell thickness with crabs and without crabs. Note, these are samples, so you will need to use STDEV.S in excel 3. Draw a table to summarise your results. Do not forget to include units. 4. Which snails have thicker shells? Write a complete sentence and suggest a reason for this finding. 2 5. Write a complete sentence to identify which snails' shell thickness is more variable? 1 PART B: Confidence Interval (9 Marks) 1. The sample without crabs is used to estimate the population mean for all snails using the Student's t-Distribution. Identify the following parameters: a. X = b. Sx= C. n= d. n-1 = 2. Construct a 90% confidence interval for the population mean snail shell thickness. 3. Use a complete sentence to explain what the confidence interval for this scenario means. 1 Template: "It is estimated with _% confidence that the true population mean (include the context of the problem) is between _ and _ (include appropriate units)." PART C: Graphing (3 Marks) 1. Use Excel to draw a column graph that shows the mean shell thickness for both crab habitats. 2. Add 'The Standard Error' as error bars. See the separate instruction sheet if you need some help. 3. Add a title and appropriate labels to your graph and copy it to your report. PART D: Hypothesis Test using the Student's t-Distribution (10 Marks) Use excel to complete a t-test for the 2 different snail populations. Ho= There is no significant difference between the thickness of shells of Littorina obtusata in a habitat with crabs compared to the thickness of their shells in a habitat without crabs 1. Write a mathematical statement to represent the null hypothesis. 2. State what the alternative hypothesis is, in words and a mathematical statement. 2 3. Calculate the P-Value, ensure you include your excel formula and results. Use the T. TEST function explained below. Check the last page on what type should be used. EXCEL =T.TEST(array1,array2,tails,type) Returns the probability associated with a Student's t-Test. arrayl is the first data set array2 is the second data set tails specifies the number of distribution tails to return, one-tailed distribution = 1; two-tailed distribution = 2. type is the kind of t-test; paired = 1, two-sample equal variance (homoscedastic) = 2, two-sample unequal variance = 3. Change your EXCEL output for the T. TEST function result in to a decimal number so it can be easily compared with P . If P > 5% then the two sets are the same (je. fail to reject the null hypothesis as P is greater) . If P
Step by Step Solution
There are 3 Steps involved in it

Get step-by-step solutions from verified subject matter experts