Question: I need a half page executive summary about the mixed plan below. An Executive Summary explaining your mixed plan in the context of the other
I need a half page executive summary about the mixed plan below.
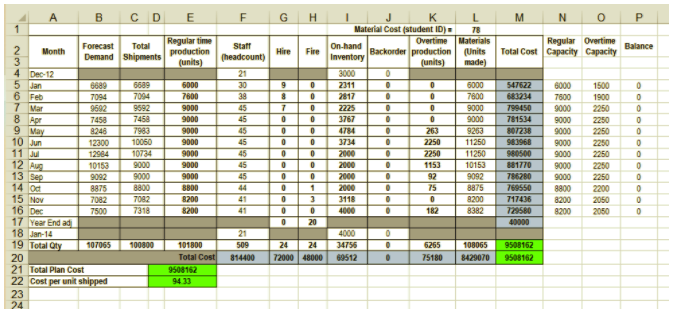
An Executive Summary explaining your mixed plan in the context of the other three plans and constraints given. Include the recommended plans total annual cost and cost per unit shipped. Your analysis should include quantitative factors (i.e.- Total Cost) and qualitative factors (i.e.- effects on morale and productivity) that drove your mixed plan.
MIXED PLAN:
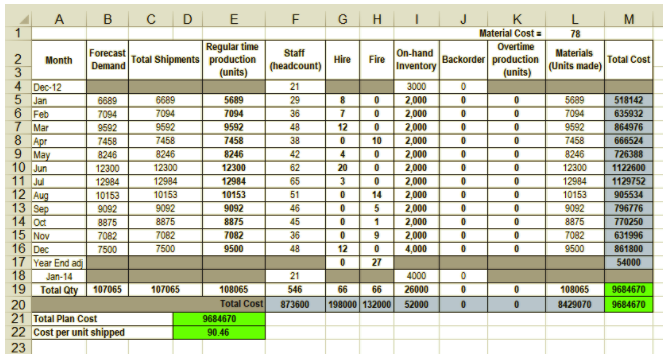
CHASE PLAN:
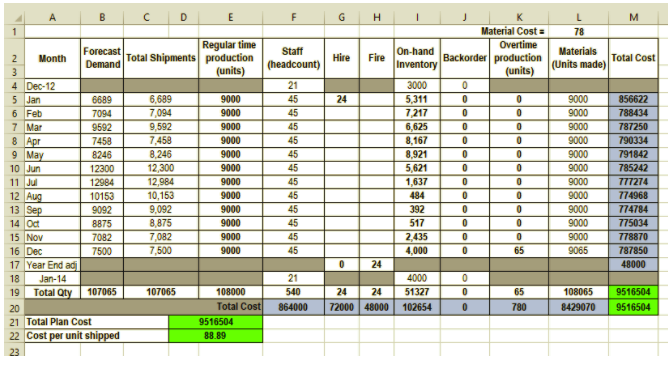
LEVEL-UTILIZATION PLAN:
B C D F G H N 0 Hire Fire Regular Overtime Total Cost Capacity Capacity Balance 547622 9 8 7 0 0 0 0 O 7 Var Staff (headcount) 21 30 38 45 45 45 45 45 45 45 44 41 41 Material Cost (student ID) 78 On-hand Overtime Materials Backorder production (Units Inventory (units) made) 3000 2311 . 0 6000 2017 0 7800 2225 . 0 9000 3767 0 9000 4784 263 9263 3734 2250 11250 2000 2250 11250 2000 . 1153 10153 2000 . 92 9092 . 75 8875 3118 0 8200 4000 182 8382 0 0 0 O E 1 Forecast 2 Regular time Total Month production Demand Shipments 3 (units) 4 Dec 12 5 Jan 6689 6689 6000 6 Feb 7094 7094 7600 9692 9692 9000 8 Apr 7458 7458 9000 9 May 8248 7983 9000 10 Jun 12300 10060 9000 11 Ju 12984 10734 9000 12 Aug 10153 9000 9000 13 Sep 9092 9000 9000 8875 8800 8800 15 Nov 7082 7082 8200 16 Dec 7500 7318 8200 17 Year End ad 18 -14 19 Total Qty 107065 100800 101800 20 Total Cost 21 Total Plan Cost 9508162 22 Cost per unit shipped 9433 23 24 6000 7600 9000 9000 9000 9000 9000 9000 9000 8800 8200 8200 1500 1900 2250 2250 2250 2250 2250 2250 2250 2200 2050 2050 0 0 OOOOOOOOOOOO 799450 781534 807238 983968 980500 881770 786280 769550 717436 729580 40000 0 0 0 0 0 0 14 Od 0 0 1 3 0 20 2000 21 509 814400 4000 34756 24 24 72000 48000 OOO 108065 69512 6265 75180 9508162 9508162 8429070 C D E F G H H L 78 M Staff (headcount) Hire Fire On-hand Inventory Materials (Units made) Total Cost 8 0 0 A B 1 Regular time Forecast 2 Month Total Shipments production Demand 3 (units) 4 Dec 12 5 Jan 6689 6689 5689 6 Feb 7094 7094 7094 7 Mar 9592 9592 9592 8 Apr 7458 7458 7458 9 May 8246 8246 8246 10 Jun 12300 12300 12300 11 Jul 12984 12984 12984 12 Aug 10153 10153 10153 13 Sep 9092 9092 9092 14 Oct 8875 8875 8875 15 Nov 7082 7082 7082 16 Dec 7500 7500 9500 17 Year End adj 18 Jan-14 19 Total Qty 107065 107065 108065 20 Total Cost 21 Total Plan Cost 9684670 22 Cost per unit shipped 90.46 23 21 29 36 48 38 42 62 65 51 46 45 36 48 7 12 0 4 20 3 0 0 0 0 12 0 0 10 0 0 0 14 5 1 9 0 27 3000 2,000 2,000 2,000 2,000 2,000 2,000 2,000 2,000 2,000 2,000 2,000 4,000 K Material Cost = Overtime Backorder production (units) 0 0 0 0 0 0 0 0 0 0 0 0 0 0 0 0 0 0 0 0 0 0 0 0 0 5689 7094 9592 7458 8246 12300 12984 10153 9092 8875 7082 9500 518142 635932 864976 666524 726388 1122600 1129752 905534 796776 770250 631996 861800 54000 9 21 546 873600 66 66 198000 132000 4000 26000 52000 0 0 0 0 0 108065 8429070 9684670 9684670 A G H M L 78 Hire Fire On-hand Inventory Materials Total Cost (Units made) 24 B D E F 1 Forecast Regular time Staff 2 Month Demand Total Shipments production (headcount) (units) 3 4 Dec-12 21 5 Jan 6689 6,689 9000 45 6 Feb 7094 7094 9000 45 7 Mar 9592 9,592 9000 45 8 Apr 7458 7,458 9000 45 9 May 8246 8.246 9000 45 10 Jun 12300 12,300 9000 45 11 Jul 12984 12,984 9000 45 12 Aug 10153 10,153 9000 45 13 Sep 9092 9,092 9000 45 14 Od 8875 8,875 9000 45 15 Nov 7082 7,082 9000 45 16 Dec 7500 7,500 9000 45 17 Year End adj 18 Jan-14 21 19 Total Qty 107065 107065 108000 540 20 Total Cost 864000 21 Total Plan Cost 9516504 22 Cost per unit shipped 88.89 23 3000 5,311 7,217 6,625 8,167 8,921 5,621 1,637 484 392 517 2,435 4,000 Material Cost = Overtime Backorder production (units) 0 0 0 0 0 0 0 0 0 0 0 0 0 0 0 0 0 0 0 0 0 0 0 0 65 9000 9000 9000 9000 9000 9000 9000 9000 9000 9000 9000 9065 856622 788434 787250 790334 791842 785242 777274 774968 774784 775034 778870 787850 48000 I. 0 24 24 24 72000 48000 4000 51327 102654 DOO 65 780 108065 8429070 9516504 9516504


