

Question: I need a ratio analysis for an excel spreadsheet Financial analysis: -also need dollar change between each year -need percent change between each year -calculate
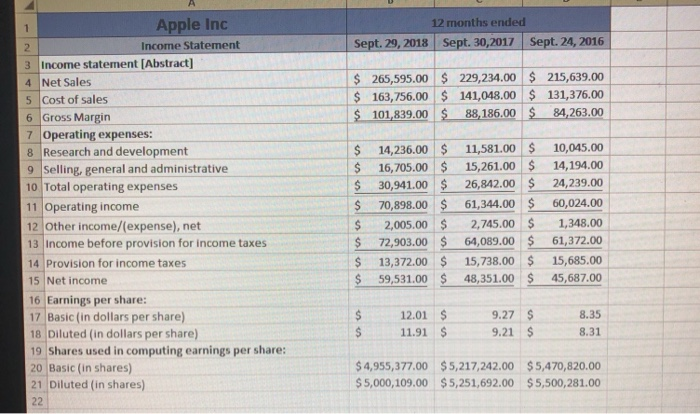
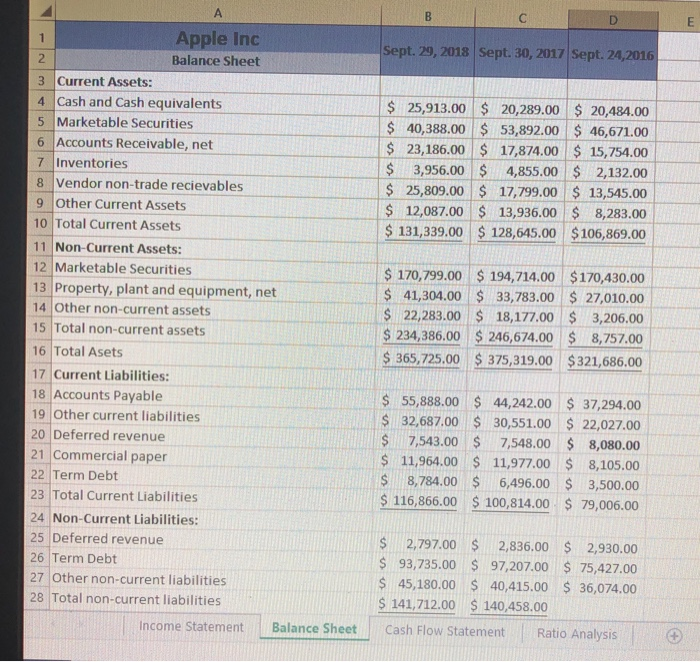
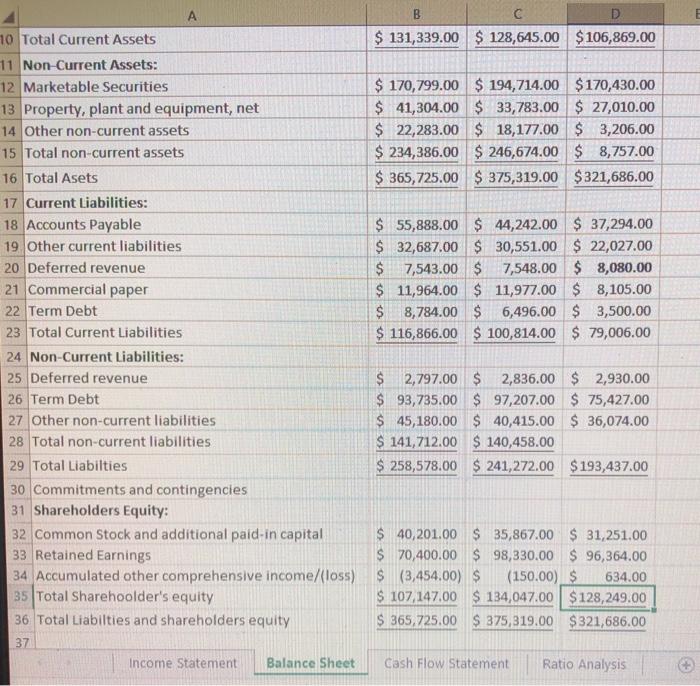
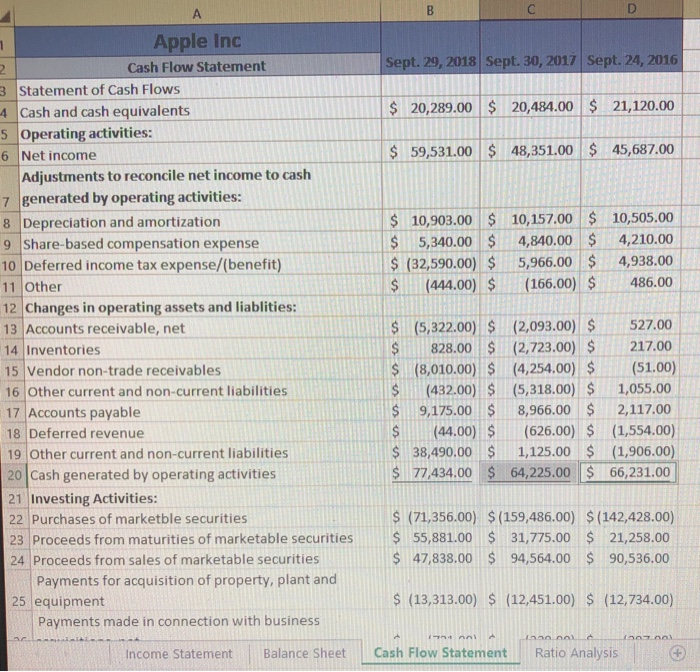
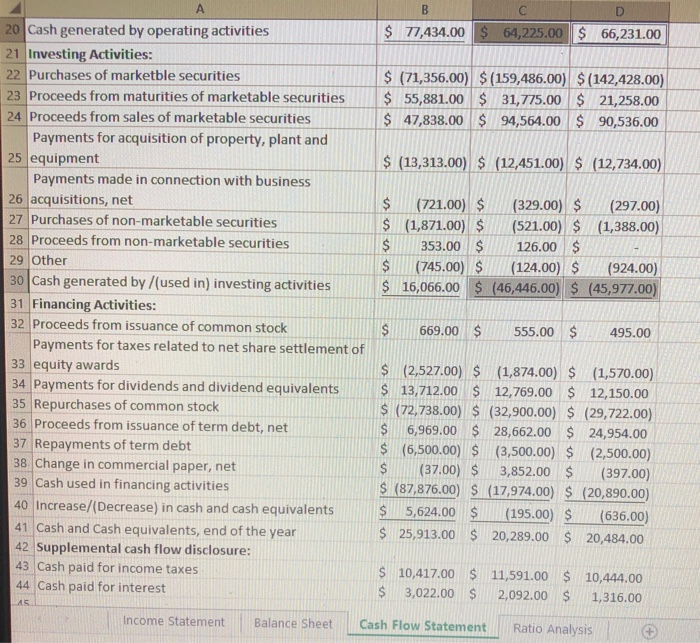
12 months ended Apple Inc Income Statement Sept.29, 2018 Sept. 30,2017 Sept. 24, 2016 3 Income statement [Abstract] 4 Net Sales 5 Cost of sales 6 Gross Margin 265,595.00 229,234.00 215,639.00 $163,756.00141,048.00 131,376.00 101,839.00 88,186.00S 84,263.00 Operating expenses: 8 Research and development 9Selling, general and administrative 10 Total operating expenses 11 Operating income 12 Other income/(expense), net 13 Income before provision for income taxes 14 Provision for income taxes 15 Net income 16 Earnings per share: 17 Basic (in dollars per share) 18 Diluted (in dollars per share) 19 Shares used in computing earnings per share: 20 Basic (in shares) 21 Diluted (in shares) $ 14,236.0011,581.00 S 10,045.00 S 16,705.00 15,261.00 14,194.00 26,842.00 24,239.00 61,344.00 60,024.00 $ 30,941.00 $ 70,898.00 $ 2,005.00$2,745.001,348.00 $72,903.00 $ 64,089.00 61,372.00 s 13,372.00 15,738.00 15,685.00 $ 59,531.00 48,351.00$45,687.00 $12.01 $ 11.91 $ 9.27 $ 9.21 $ 8.35 8.31 4,955,377.00 $5,217,242.00 $5,470,820.00 5,000,109.00 $5,251,692.00 $5,500,281.00 Apple Inc Balance Sheet Sept. 29, 2018 | Sept. 30, 2017 | Sept. 24,2016 2 3 Current Assets: 4 Cash and Cash equivalents 5 Marketable Securities $ 25,913.00 20,289.00 20,484.00 $40,388.00 53,892.00 46,671.00 23,186.00 17,874.00 15,754.00 3,956.00 855.00 2,132.00 $ 25,809.00 $ 17,799.00 $ 13,545.00 12,087.00 13,936.00 8,283.00 $ 131,339.00 128,645.00 $106,869.00 6 Accounts Receivable, net 7 Inventories 8 Vendor non-trade recievables 9 Other Current Assets 10 Total Current Assets 11 Non-Current Assets: 12 Marketable Securities S 170,799.00 $ 194,714.00 $170,430.00 $41,304.00 $ 33,783.00 $ 27,010.00 $ 22,283.00 18,177.00$ 3,206.00 234,36.00 246,674.00 $ 8,757.00 36,725,00 375,319.00 $321,686.00 13 Property, plant and equipment, net 14 Other non-current assets 15 Total non-current assets 16 Total Asets 17 Current Liabilities: 18 Accounts Payable 19 Other current liabilities 20 Deferred revenue 21 Commercial paper 22 Term Debt 23 Total Current Liabilities 24 Non-Current Liabilities: 25 Deferred revenue 26 Term Debt 27 Other non-current liabilities 28 Total non-current liabilities $ 55,888.00 $ 44,242.00 37,294.00 $ 32,687.00 30,551.00 $22,027.00 $7,543.00$ 7,548.00 $ 8,080.00 s 11,964.00 S 11,977.00 8,105.00 $ 8,784.00 6,496.00 $3,500.00 $ 116,866.00 $ 100,814.00 S 79,006.00 $ 2,797.00 S 2,836.00 2,930.00 $ 93,735.00 $ 97,207.00 $ 75,427.00 $ 45,180.00 S 40,415.00 $ 36,074.00 S 141,712.00 S 140,458.00 income Statement Balance Sheet Cash Flow Statement Ratio Analysis $131,339.00 128,645.00 $106,869.00 10 Total Current Assets 11 Non-Current Assets: 12 Marketable Securities 13 Property, plant and equipment, net 14 Other non-current assets 15 Total non-current assets 16 Total Asets 17 Current Liabilities: 18 Accounts Payable 19 Other current liabilities 20 Deferred revenue 21 Commercial paper 22 Term Debt 23 Total Current Liabilities 24 Non-Current Liabilities: 25 Deferred revenue 26 Term Debt 27 Other non-current liabilities 28 Total non-current liabilities 29 Total Liabilties $170,799.00 194,714.00 $170,430.00 $41,304.00 33,783.00 27,010.00 $ 22,283.00 18,177.00 3,206.00 $234,386.00 246,674.00 8,757.00 365,725.00 375,319.00 $321,686.00 44,242.00 37,294.00 32,687.00 30,551.00 $ 22,027.00 $7,543.00 7,548.00 8,080.00 $ 11,964.00 $ 11,977.00 8,105.00 $8,784.00 6,496.00 3,500.00 $ 116,866.00 100,814.00 $ 79,006.00 S55,888.0 $2,797.00 2,836.00 2,930.00 93,735.00 $ 97,207.00 75,427.00 $ 45,180.00 $ 40,415.00$ 36,074.00 S 141,712.00 $ 140,458.00 $ 258,578.00 $241,272.00 $193,437.00 30 Commitments and contingencies 31 Shareholders Equity: 32 Common Stock and additional paid-in capital 33 Retained Earnings 34 Accumulated other comprehensive income/(loss) 35 Total Sharehoolder's equity 36 Total Liabilties and shareholders equity 37 $40,201.00 $35,867.00 31,251.00 $70,400.00 $ 98,330.00 $ 96,364.00 (150.00) $634.00 S 107 14700 134,04700 $128,249.00 365,725.00 S 375,319.00 $321,686.00 $ (3,454.00) $ Income Statement Balance Sheet Cash Flow StatementRatio Analysis Apple Inc Cash Flow Statement Sept. 29, 2018 Sept. 30, 2017 Sept. 24, 2016 $20,289.00 20,484.00 21,120.00 $59,531.00 $ 48,351.00 45,687.00 3 Statement of Cash Flows 4 Cash and cash equivalents s Operating activities 6 Net income Adjustments to reconcile net income to cash 7 generated by operating activities 8 Depreciation and amortization 10,903.00 10,157.00 10,505.00 $5,340.00 4,840.004,210.00 (32,590.005,966.00 4,938.00 9 Share-based compensation expense 10 Deferred income tax expense/(benefit) 11 Other 12 Changes in operating assets and liablities: 13 Accounts receivable, net S (444.00)166.00) 4 486.00 14 Inventories 15 Vendor non-trade receivables 16 Other current and non-current liabilities 17 Accounts payable 18 Deferred revenue S (5,322.00(2,093.00) S 527.00 $828.00 (2,723.00) 217.00 $ (8,010.00)S (4,254.00) (S1.00) $(432.00) S (5,318.00) S 1,055.00 S9,175.00 8,966.00 2,117.00 (44.00) S (626.00) $ (1,554.00) $ 38,490.00 $ 1,125.00 (1,906.00) 77,434.00 64,225.00 66,231.00 19 Other current and non-current liabilities 20 Cash generated by operating activities 21 Investing Activities: 22 Purchases of marketble securities 23 Proceeds from maturities of marketable securities$ 55,881.00 $ 31,775.00 $21,258.00 24 Proceeds from sales of marketable securities S (71,356.00) $(159,486.00) $(142,428.00) $47,838.00 $ 94,564.00 $ 90,536.00 S (13,313.00) S (12,451.00) $ (12,734.00) Payments for acquisition of property, plant and 25 equipment Payments made in connection with business Income Statement Balance Sheet Cash Flow Statement Ratio Analysis Cash generated by operating activities $ 77,434.00 00 $ 64,225.00 S 66,231.00 Investing Activities: 22 Purchases of marketble securities 23 Proceeds from maturities of marketable securities $ (71,356.00) $ (159,486.00 (142,428.00) 55,881.00 31,775.00 $ 21,258.00 $ 47,838.00 94,564.00 90,536.00 Proceeds from sales of marketable securities Payments for acquisition of property, plant and 25 equipment (13,313.00) S (12,451.00)(12,734.00) Payments made in connection with business 26 acquisitions, net 27 Purchases of non-marketable securities 28 Proceeds from non-marketable securities 29 Other 30 Cash generated by /(used in) investing activitiesS 31 Financing Activities: 32 Proceeds from issuance of common stock $(721.00)(329.00)(297.00) (1,871.00)$(521.00) $ (1,388.00) $353.00 126.00 (745.00)124.00)(924.00) 16,066.00 S (46,446.00) $ (45,977.00) S669.00 555.00495.00 Payments for taxes related to net share settlement of 33 equity awards 34 Payments for dividends and dividend equivalents $ 13.712.00 S 12,769.00 35 Repurchases of common stock 36 Proceeds from issuance of term debt, net 7 Repayments of term debt 38 Change in commercial paper, net 39 Cash used in financing activities 40 Increase/(Decrease) in cash and cash equivalents 41 Cash and Cash equivalents, end of the year 42 Supplemental cash flow disclosure: 43 Cash paid for income taxes 44 Cash paid for interest $ (2,527.00) $ (1,874.00) $ (1,570.00) 12,150.00 $ (72,738.00) S (32,900.00) $ (29,722.00) 6,969.00 $ 28,662.00 24,954.00 s (6,500.00) $ (3,500.00(2,500.00) $(37.00) $ 3,852.00 (397.00) S (87,876.00 S (17.974.00) S (20,890.00) $ 5,624.00 $ (195.00) (636.00) S 25,913.00 $20,289.00 $ 20,484.00 S 10,417.00 $ 11,591.00 $ 10,444.00 $ 3,022.00 $ 2,092.00 1,316.00 income Statement Balance Sheet Cash Flow StatementRatio Analysis 12 months ended Apple Inc Income Statement Sept.29, 2018 Sept. 30,2017 Sept. 24, 2016 3 Income statement [Abstract] 4 Net Sales 5 Cost of sales 6 Gross Margin 265,595.00 229,234.00 215,639.00 $163,756.00141,048.00 131,376.00 101,839.00 88,186.00S 84,263.00 Operating expenses: 8 Research and development 9Selling, general and administrative 10 Total operating expenses 11 Operating income 12 Other income/(expense), net 13 Income before provision for income taxes 14 Provision for income taxes 15 Net income 16 Earnings per share: 17 Basic (in dollars per share) 18 Diluted (in dollars per share) 19 Shares used in computing earnings per share: 20 Basic (in shares) 21 Diluted (in shares) $ 14,236.0011,581.00 S 10,045.00 S 16,705.00 15,261.00 14,194.00 26,842.00 24,239.00 61,344.00 60,024.00 $ 30,941.00 $ 70,898.00 $ 2,005.00$2,745.001,348.00 $72,903.00 $ 64,089.00 61,372.00 s 13,372.00 15,738.00 15,685.00 $ 59,531.00 48,351.00$45,687.00 $12.01 $ 11.91 $ 9.27 $ 9.21 $ 8.35 8.31 4,955,377.00 $5,217,242.00 $5,470,820.00 5,000,109.00 $5,251,692.00 $5,500,281.00 Apple Inc Balance Sheet Sept. 29, 2018 | Sept. 30, 2017 | Sept. 24,2016 2 3 Current Assets: 4 Cash and Cash equivalents 5 Marketable Securities $ 25,913.00 20,289.00 20,484.00 $40,388.00 53,892.00 46,671.00 23,186.00 17,874.00 15,754.00 3,956.00 855.00 2,132.00 $ 25,809.00 $ 17,799.00 $ 13,545.00 12,087.00 13,936.00 8,283.00 $ 131,339.00 128,645.00 $106,869.00 6 Accounts Receivable, net 7 Inventories 8 Vendor non-trade recievables 9 Other Current Assets 10 Total Current Assets 11 Non-Current Assets: 12 Marketable Securities S 170,799.00 $ 194,714.00 $170,430.00 $41,304.00 $ 33,783.00 $ 27,010.00 $ 22,283.00 18,177.00$ 3,206.00 234,36.00 246,674.00 $ 8,757.00 36,725,00 375,319.00 $321,686.00 13 Property, plant and equipment, net 14 Other non-current assets 15 Total non-current assets 16 Total Asets 17 Current Liabilities: 18 Accounts Payable 19 Other current liabilities 20 Deferred revenue 21 Commercial paper 22 Term Debt 23 Total Current Liabilities 24 Non-Current Liabilities: 25 Deferred revenue 26 Term Debt 27 Other non-current liabilities 28 Total non-current liabilities $ 55,888.00 $ 44,242.00 37,294.00 $ 32,687.00 30,551.00 $22,027.00 $7,543.00$ 7,548.00 $ 8,080.00 s 11,964.00 S 11,977.00 8,105.00 $ 8,784.00 6,496.00 $3,500.00 $ 116,866.00 $ 100,814.00 S 79,006.00 $ 2,797.00 S 2,836.00 2,930.00 $ 93,735.00 $ 97,207.00 $ 75,427.00 $ 45,180.00 S 40,415.00 $ 36,074.00 S 141,712.00 S 140,458.00 income Statement Balance Sheet Cash Flow Statement Ratio Analysis $131,339.00 128,645.00 $106,869.00 10 Total Current Assets 11 Non-Current Assets: 12 Marketable Securities 13 Property, plant and equipment, net 14 Other non-current assets 15 Total non-current assets 16 Total Asets 17 Current Liabilities: 18 Accounts Payable 19 Other current liabilities 20 Deferred revenue 21 Commercial paper 22 Term Debt 23 Total Current Liabilities 24 Non-Current Liabilities: 25 Deferred revenue 26 Term Debt 27 Other non-current liabilities 28 Total non-current liabilities 29 Total Liabilties $170,799.00 194,714.00 $170,430.00 $41,304.00 33,783.00 27,010.00 $ 22,283.00 18,177.00 3,206.00 $234,386.00 246,674.00 8,757.00 365,725.00 375,319.00 $321,686.00 44,242.00 37,294.00 32,687.00 30,551.00 $ 22,027.00 $7,543.00 7,548.00 8,080.00 $ 11,964.00 $ 11,977.00 8,105.00 $8,784.00 6,496.00 3,500.00 $ 116,866.00 100,814.00 $ 79,006.00 S55,888.0 $2,797.00 2,836.00 2,930.00 93,735.00 $ 97,207.00 75,427.00 $ 45,180.00 $ 40,415.00$ 36,074.00 S 141,712.00 $ 140,458.00 $ 258,578.00 $241,272.00 $193,437.00 30 Commitments and contingencies 31 Shareholders Equity: 32 Common Stock and additional paid-in capital 33 Retained Earnings 34 Accumulated other comprehensive income/(loss) 35 Total Sharehoolder's equity 36 Total Liabilties and shareholders equity 37 $40,201.00 $35,867.00 31,251.00 $70,400.00 $ 98,330.00 $ 96,364.00 (150.00) $634.00 S 107 14700 134,04700 $128,249.00 365,725.00 S 375,319.00 $321,686.00 $ (3,454.00) $ Income Statement Balance Sheet Cash Flow StatementRatio Analysis Apple Inc Cash Flow Statement Sept. 29, 2018 Sept. 30, 2017 Sept. 24, 2016 $20,289.00 20,484.00 21,120.00 $59,531.00 $ 48,351.00 45,687.00 3 Statement of Cash Flows 4 Cash and cash equivalents s Operating activities 6 Net income Adjustments to reconcile net income to cash 7 generated by operating activities 8 Depreciation and amortization 10,903.00 10,157.00 10,505.00 $5,340.00 4,840.004,210.00 (32,590.005,966.00 4,938.00 9 Share-based compensation expense 10 Deferred income tax expense/(benefit) 11 Other 12 Changes in operating assets and liablities: 13 Accounts receivable, net S (444.00)166.00) 4 486.00 14 Inventories 15 Vendor non-trade receivables 16 Other current and non-current liabilities 17 Accounts payable 18 Deferred revenue S (5,322.00(2,093.00) S 527.00 $828.00 (2,723.00) 217.00 $ (8,010.00)S (4,254.00) (S1.00) $(432.00) S (5,318.00) S 1,055.00 S9,175.00 8,966.00 2,117.00 (44.00) S (626.00) $ (1,554.00) $ 38,490.00 $ 1,125.00 (1,906.00) 77,434.00 64,225.00 66,231.00 19 Other current and non-current liabilities 20 Cash generated by operating activities 21 Investing Activities: 22 Purchases of marketble securities 23 Proceeds from maturities of marketable securities$ 55,881.00 $ 31,775.00 $21,258.00 24 Proceeds from sales of marketable securities S (71,356.00) $(159,486.00) $(142,428.00) $47,838.00 $ 94,564.00 $ 90,536.00 S (13,313.00) S (12,451.00) $ (12,734.00) Payments for acquisition of property, plant and 25 equipment Payments made in connection with business Income Statement Balance Sheet Cash Flow Statement Ratio Analysis Cash generated by operating activities $ 77,434.00 00 $ 64,225.00 S 66,231.00 Investing Activities: 22 Purchases of marketble securities 23 Proceeds from maturities of marketable securities $ (71,356.00) $ (159,486.00 (142,428.00) 55,881.00 31,775.00 $ 21,258.00 $ 47,838.00 94,564.00 90,536.00 Proceeds from sales of marketable securities Payments for acquisition of property, plant and 25 equipment (13,313.00) S (12,451.00)(12,734.00) Payments made in connection with business 26 acquisitions, net 27 Purchases of non-marketable securities 28 Proceeds from non-marketable securities 29 Other 30 Cash generated by /(used in) investing activitiesS 31 Financing Activities: 32 Proceeds from issuance of common stock $(721.00)(329.00)(297.00) (1,871.00)$(521.00) $ (1,388.00) $353.00 126.00 (745.00)124.00)(924.00) 16,066.00 S (46,446.00) $ (45,977.00) S669.00 555.00495.00 Payments for taxes related to net share settlement of 33 equity awards 34 Payments for dividends and dividend equivalents $ 13.712.00 S 12,769.00 35 Repurchases of common stock 36 Proceeds from issuance of term debt, net 7 Repayments of term debt 38 Change in commercial paper, net 39 Cash used in financing activities 40 Increase/(Decrease) in cash and cash equivalents 41 Cash and Cash equivalents, end of the year 42 Supplemental cash flow disclosure: 43 Cash paid for income taxes 44 Cash paid for interest $ (2,527.00) $ (1,874.00) $ (1,570.00) 12,150.00 $ (72,738.00) S (32,900.00) $ (29,722.00) 6,969.00 $ 28,662.00 24,954.00 s (6,500.00) $ (3,500.00(2,500.00) $(37.00) $ 3,852.00 (397.00) S (87,876.00 S (17.974.00) S (20,890.00) $ 5,624.00 $ (195.00) (636.00) S 25,913.00 $20,289.00 $ 20,484.00 S 10,417.00 $ 11,591.00 $ 10,444.00 $ 3,022.00 $ 2,092.00 1,316.00 income Statement Balance Sheet Cash Flow StatementRatio Analysis
Step by Step Solution
There are 3 Steps involved in it

Get step-by-step solutions from verified subject matter experts