

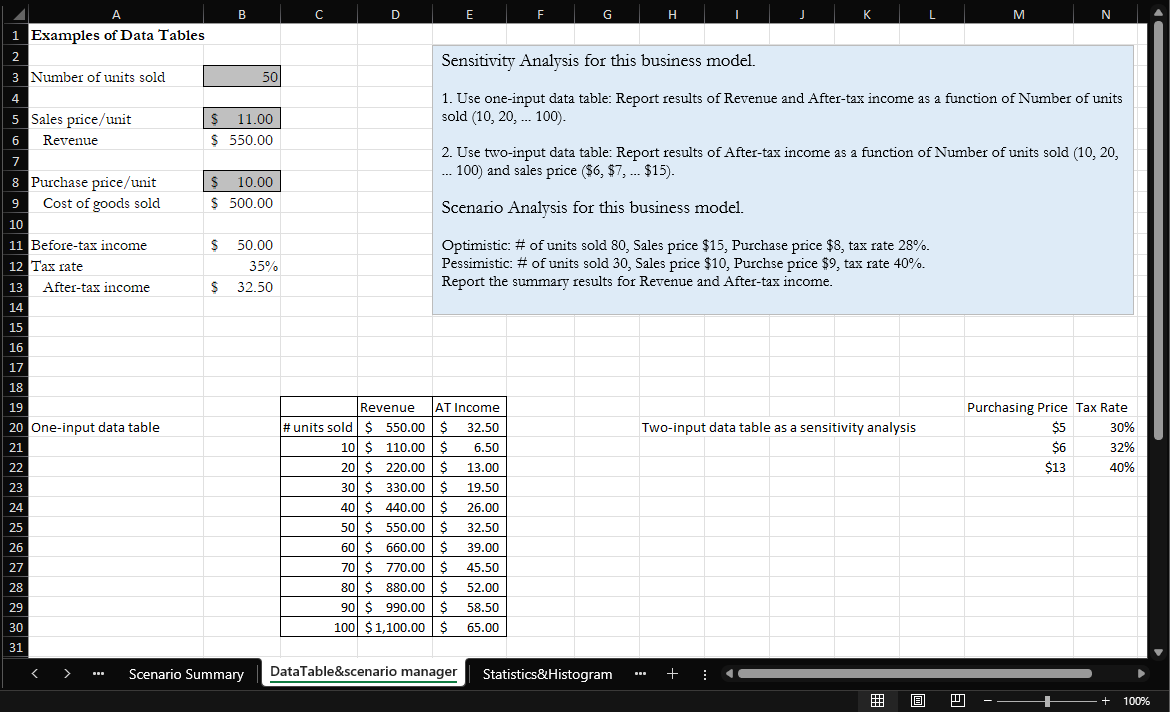
Question: I need a step by step answer to create a two - input data table as a sensitivity analysis in excel: In sheet Data table
I need a step by step answer to create a twoinput data table as a sensitivity analysis in excel: In sheet Data table & scenario manager after you have followed the course videos to create oneinput data table and twoinput data table, on the same page, create another twoinput data table as a sensitivity analysis. We want to see how purchasing price and tax rate together affect aftertax income. Use a twoinput data table to show Aftertax income as a function of purchasing price $ $$ and tax rate
Step by Step Solution
There are 3 Steps involved in it
1 Expert Approved Answer
Step: 1 Unlock

Question Has Been Solved by an Expert!
Get step-by-step solutions from verified subject matter experts
Step: 2 Unlock
Step: 3 Unlock