

Question: I need a tutor to help me understand this project. School's prompt: Many U.S. citizens do not vote in elections. One reason, among many, is
I need a tutor to help me understand this project.
School's prompt: Many U.S. citizens do not vote in elections. One reason, among many, is that they feel their votes don't count.This week, we have learned many concepts related to this issue. The authors of the following articulation, " The Sidelines Of Democracy: Exploring Why So Many Americans Don't Vote."
Give some more insight into the low voter turnout in the U.S.
What concepts have you learned in this course that can help you understand the U.S. voting process and why we do not have a larger voter turnout? (You might as well not comment on how appropriate this question is for this class, as I'm sure I think the same. I'm not sure the second part of the question can be answered based on the textbook.)
Professor's questions: Include comments about all the graphs used in the article in your discussion post. Answer the following questions For the Education Economics graph, give potential reason(s) why the two sets of graphs look almost identical. How does the usage of percent in graphs affect the graph and interpretation of the graph? How do the graphs use in the article help to slant the article in a specific direction? If you were the editor of this article, what would you have explained to the author about the graphs used? How would you change the graphs to make them more honest (hint-they are not)? Compare the graphs used by the article to the charts I have included here. In writing, and separatelywith the graphs I've included, what would be the conclusion a reader would draw about how critical different demographics are to the outcome of an election? Explain how using either graph can get an audience to see the information in a specific light.
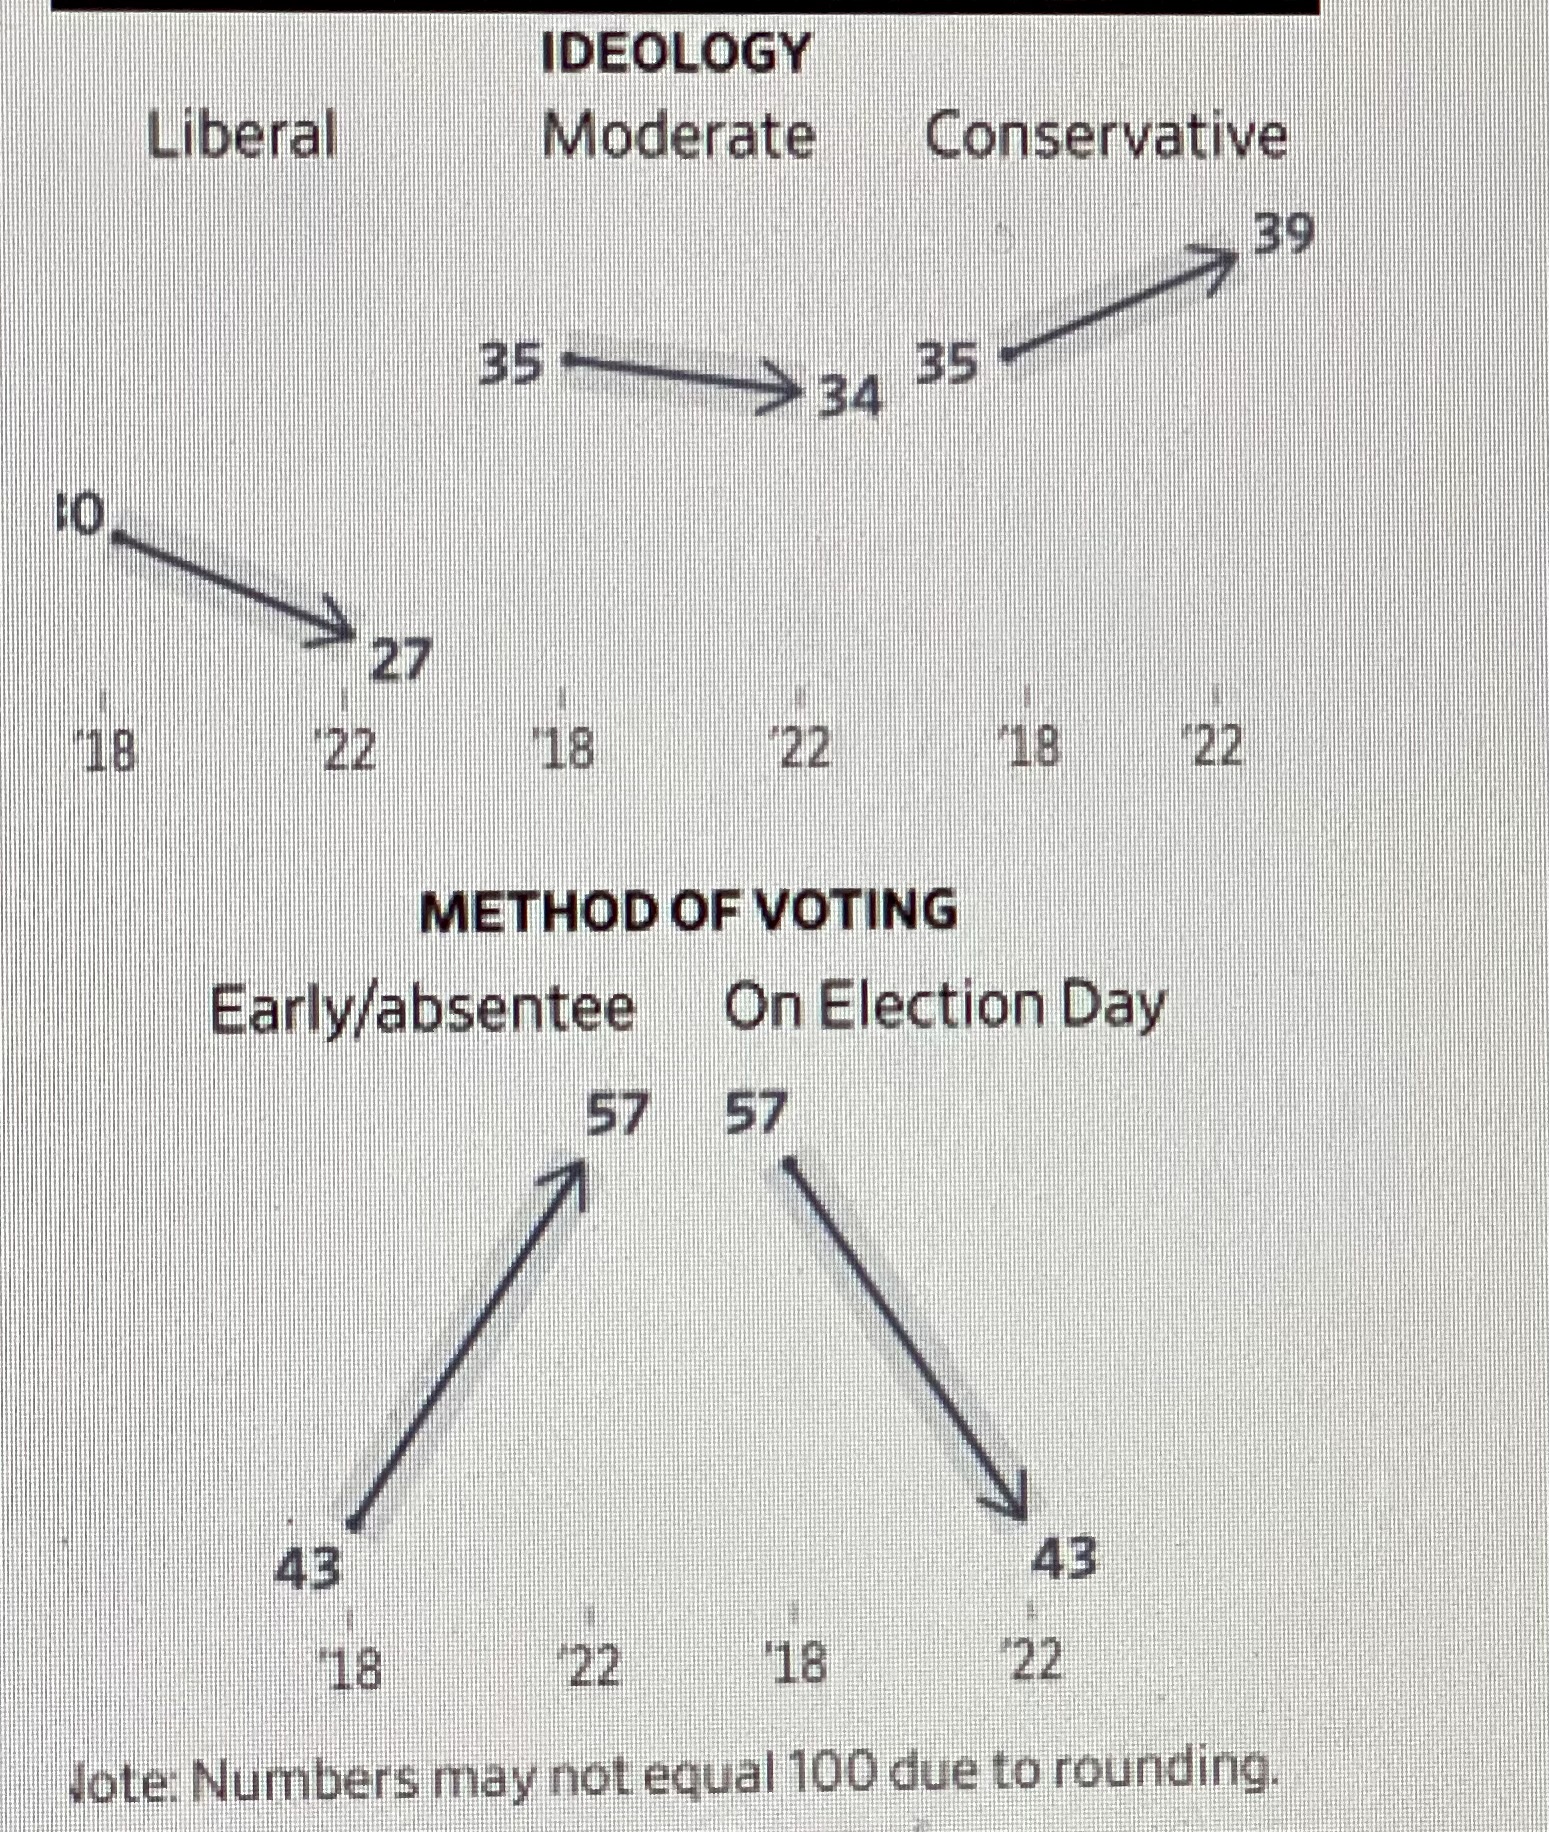
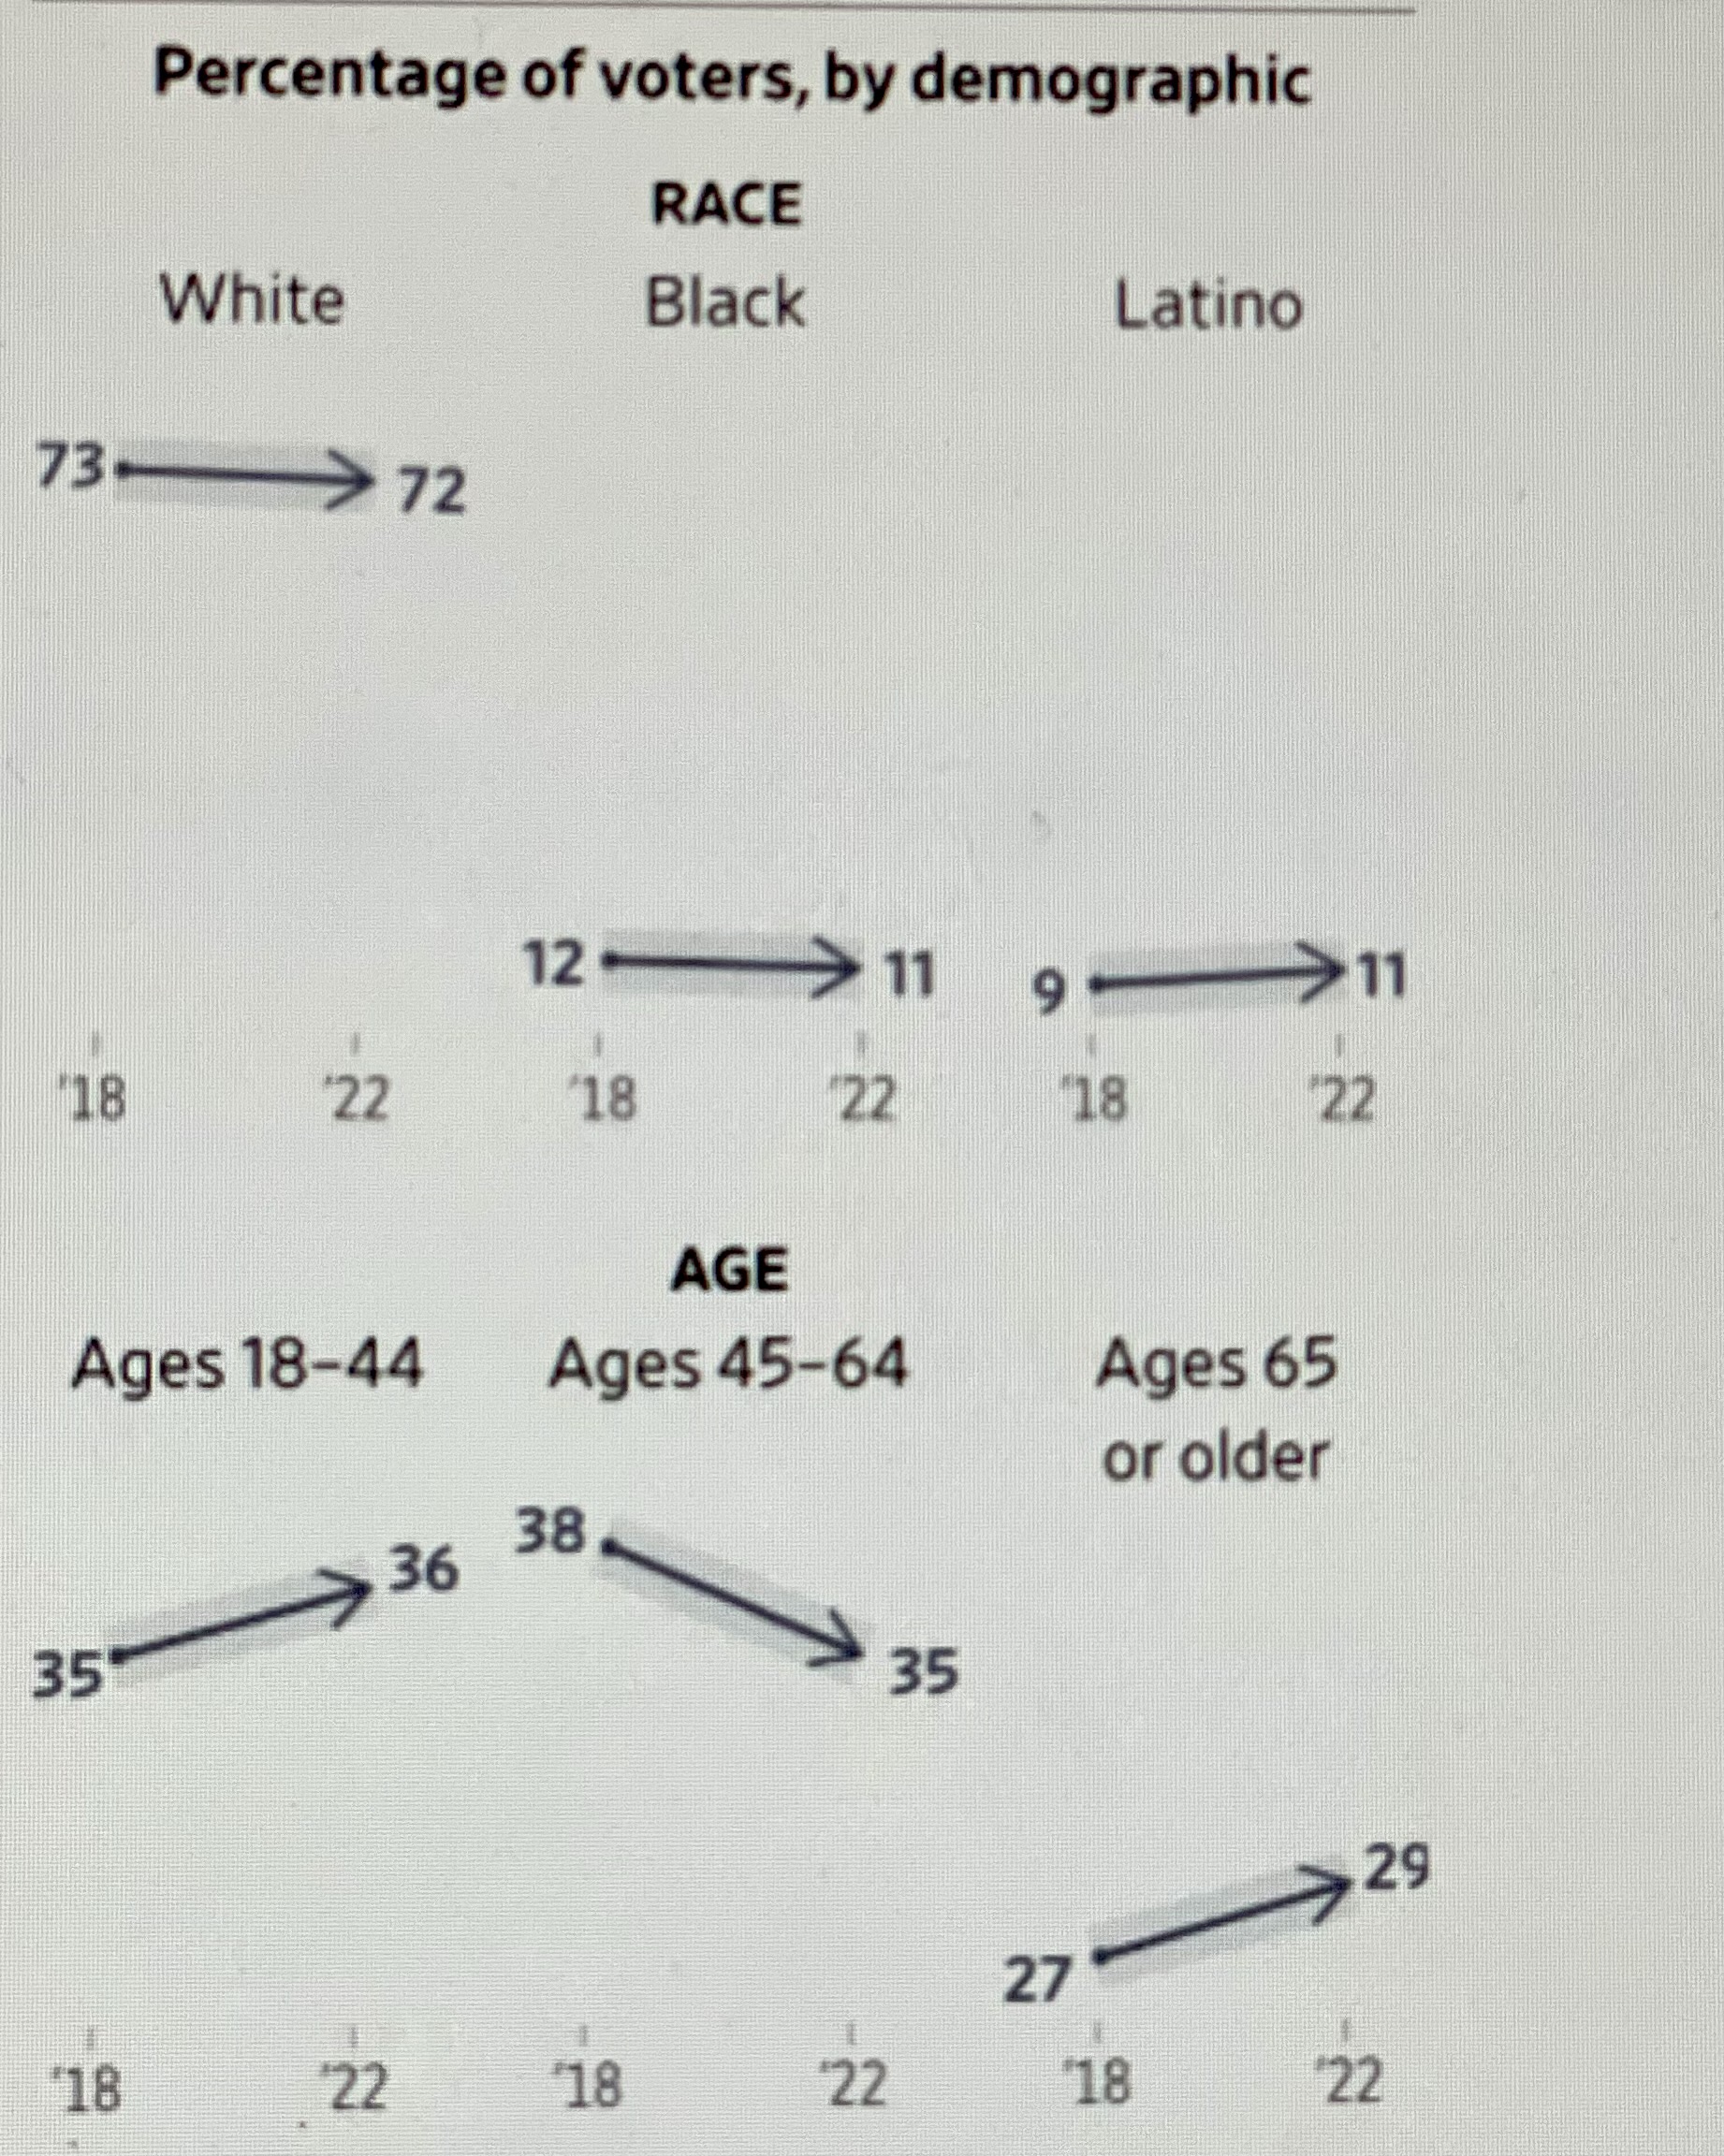
IDEOLOGY Liberal Moderate Conservative 39 35 - 34 35 27 18 22 18 22 18 22 METHOD OF VOTING Early/absentee On Election Day 57 57 43 43 18 22 18 22 Jote: Numbers may not equal 100 due to rounding.Percentage of voters, by demographic RACE White Black Latino 73-> 72 12- 11 9- ->11 "18 22 '18 22 "18 22 AGE Ages 18-44 Ages 45-64 Ages 65 or older 36 38 35 35 29 27 '18 22 18 22 18 22
Step by Step Solution
There are 3 Steps involved in it

Get step-by-step solutions from verified subject matter experts