

Question: i need answer in 30 mins Please see last 3 years ratios and financial data of a company below. You are required to give a
i need answer in 30 mins
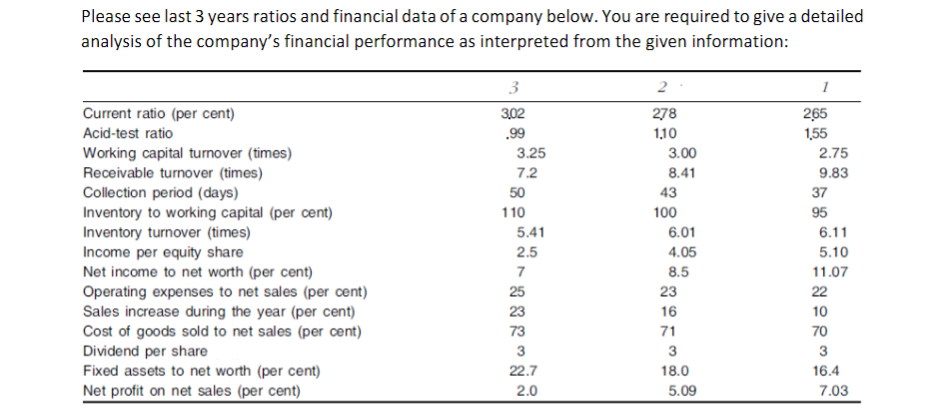
Please see last 3 years ratios and financial data of a company below. You are required to give a detailed analysis of the company's financial performance as interpreted from the given information: 3 265 3,02 .99 3.25 155 7.2 50 Current ratio (per cent) Acid-test ratio Working capital turnover (times) Receivable turnover (times) Collection period (days) Inventory to working capital (per cent) Inventory turnover (times) Income per equity share Net income to net worth (per cent) Operating expenses to net sales (per cent) Sales increase during the year (per cent) Cost of goods sold to net sales (per cent) Dividend per share Fixed assets to net worth (per cent) Net profit on net sales (per cent) 110 5.41 2.5 7 25 23 73 3 22.7 2.0 2 278 1.10 3.00 8.41 43 100 6.01 4.05 8.5 23 16 71 3 18.0 5.09 2.75 9.83 37 95 6.11 5.10 11.07 22 10 70 3 16.4 7.03
Step by Step Solution
There are 3 Steps involved in it

Get step-by-step solutions from verified subject matter experts