

Question: I need answers to all please. NOTES ON RICE Statistics Name Scatter Plot Date Period Construct a scatter plot. State if there appears to be
I need answers to all please.
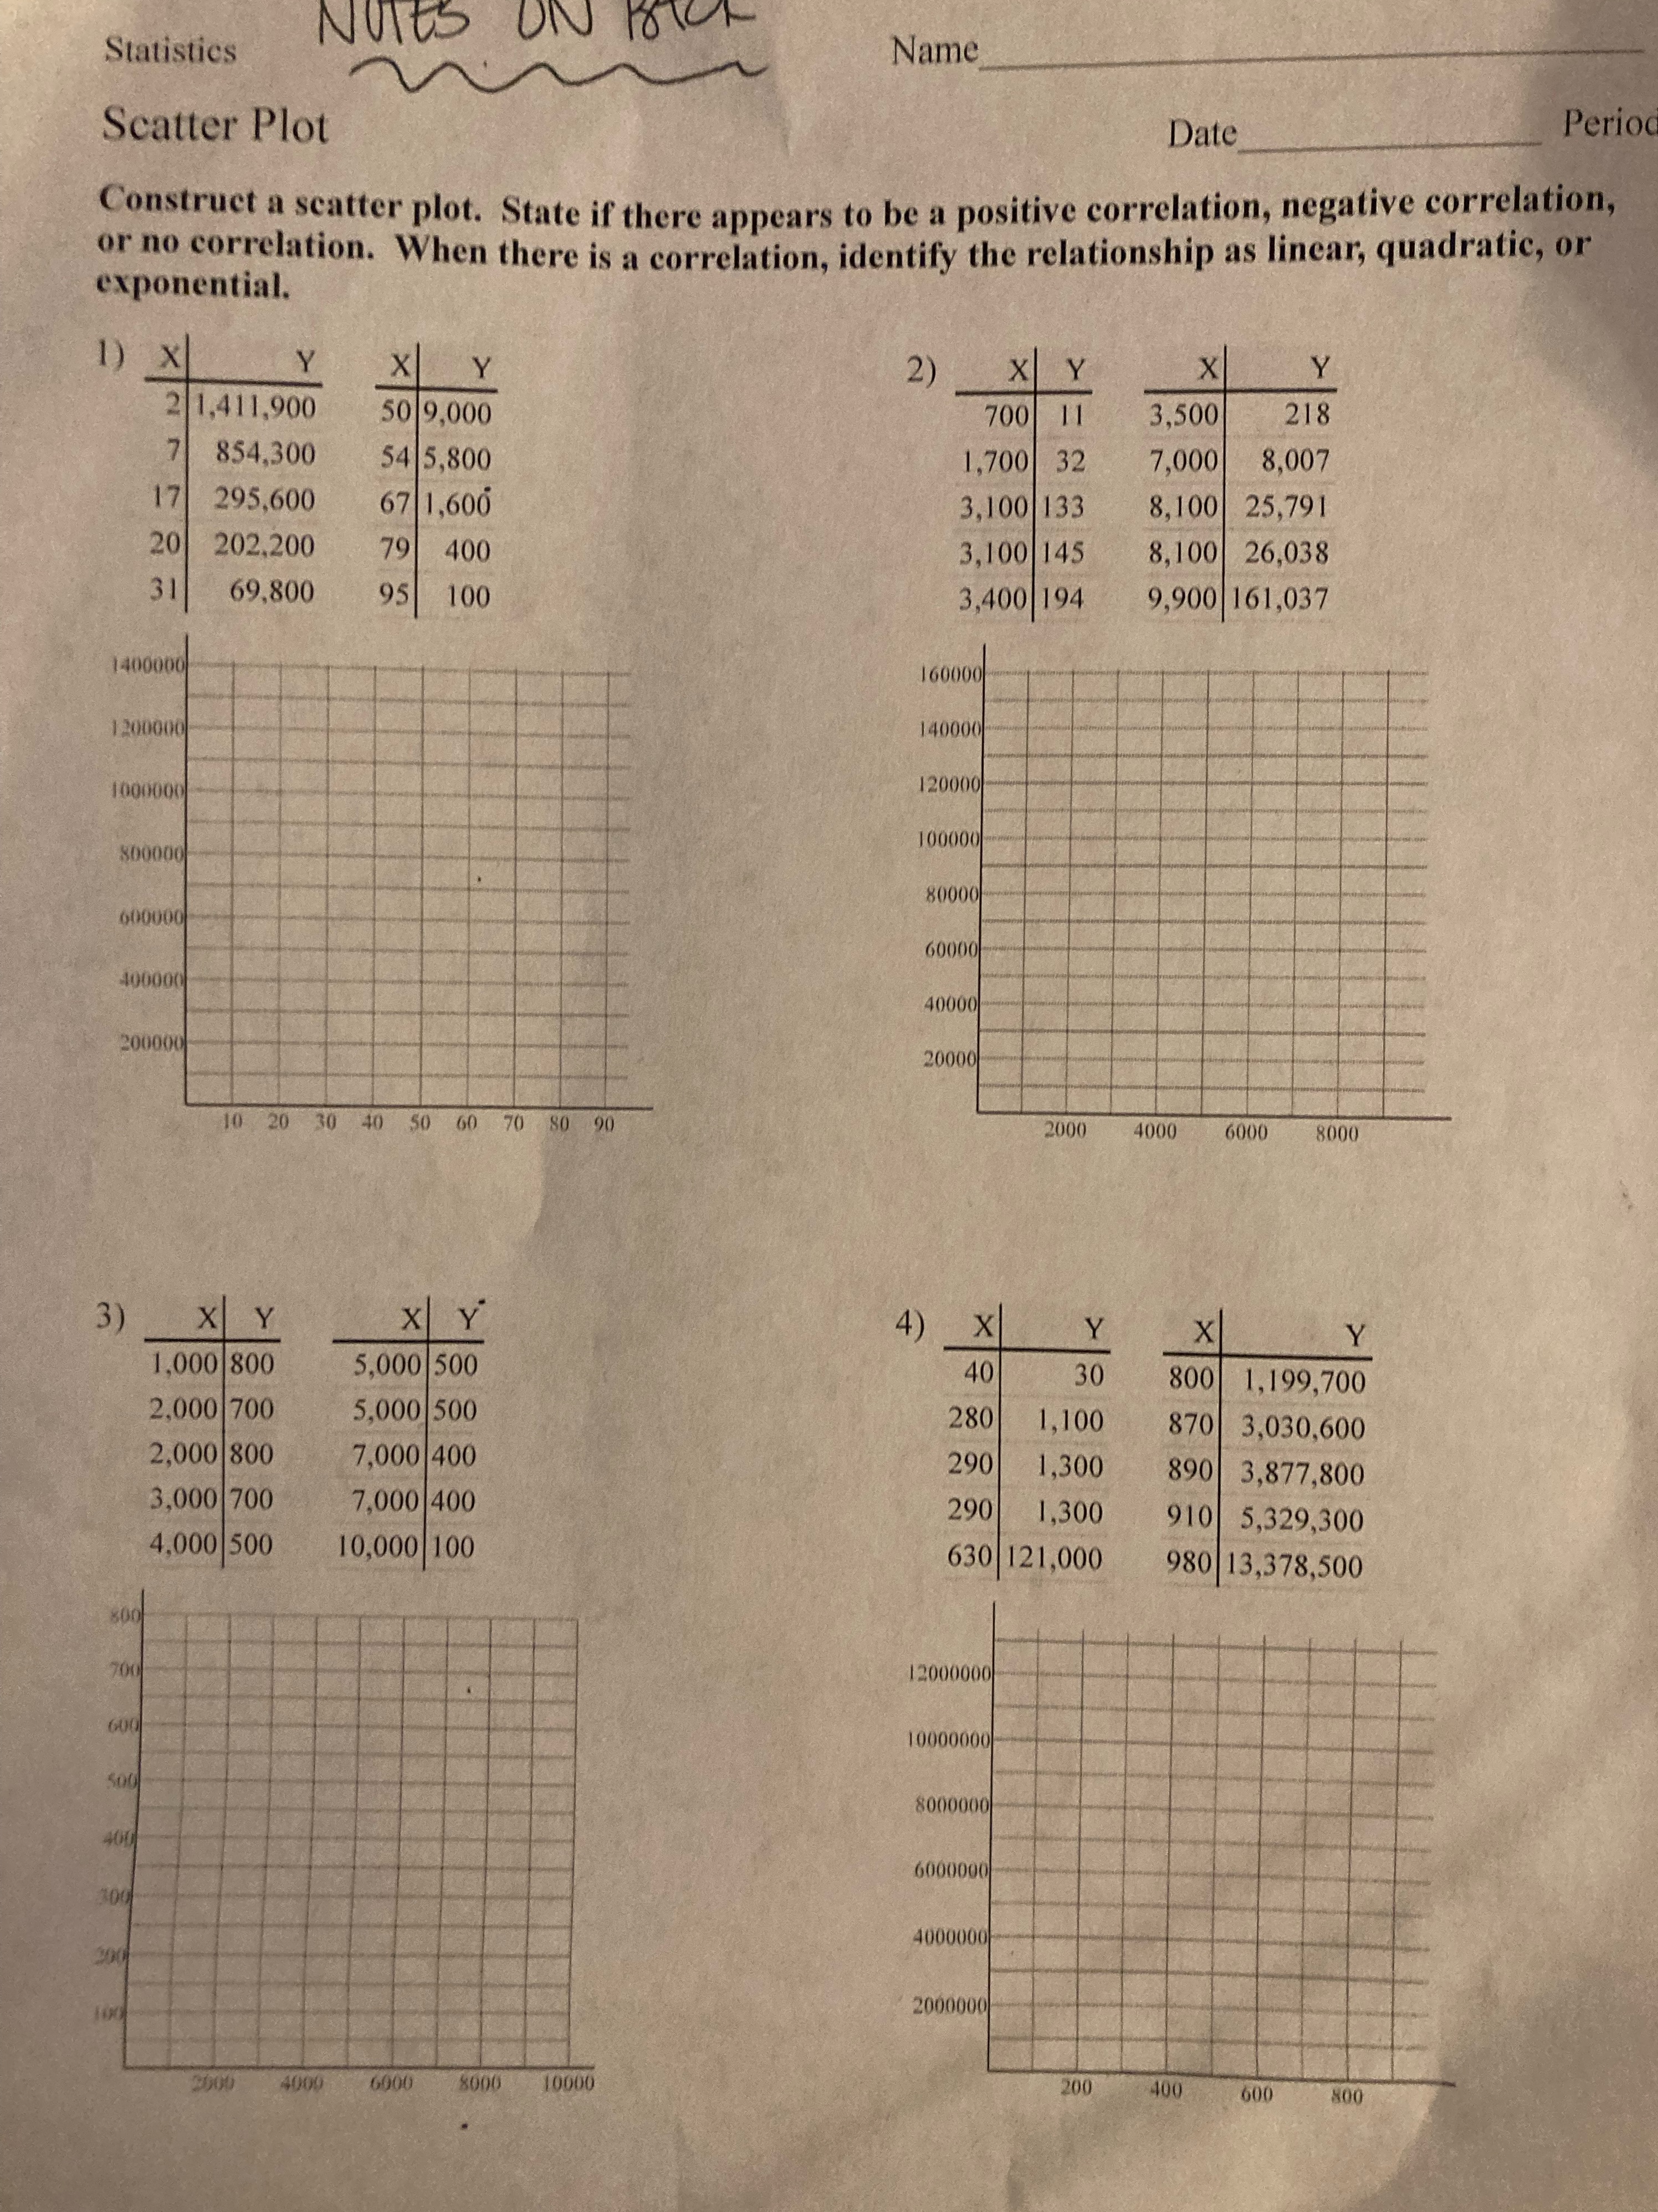
NOTES ON RICE Statistics Name Scatter Plot Date Period Construct a scatter plot. State if there appears to be a positive correlation, negative correlation, or no correlation. When there is a correlation, identify the relationship as linear, quadratic, or exponential. 1) X X Y 2) X Y X Y 1,411,900 50 9,000 700 11 3,500 218 854.300 54 5,800 1,700 32 7,000 8,007 17 295,600 67 1,600 3,100 133 8, 100 25,791 20 202.200 79 400 3,100 145 8,100 26,038 31 69,800 95 100 3,400 194 9,900 161,037 1400000 160000 1200000 140000 1009090 120900 100000 809000 80000 609090 60000 406090 40000 200000 20000 10 20 30 40 50 60 70 80 90 2000 4000 6000 8000 3) X Y X Y 4) X X 1,000 800 5,000 500 40 30 800 1, 199,700 2,000 700 5,000 500 280 1,100 870 3,030,600 2,000 800 7,000 400 290 1,300 890 3,877,800 3,000 700 7,000 400 290 1,300 910 5,329,300 4,000 500 10,000 100 630 121,000 980 13,378,500 800 700 12000060 GOO 10900000 500 8000000 460 6000000 100 4000000 2000000 2600 4000 6900 8000 10600 200 400 600 800
Step by Step Solution
There are 3 Steps involved in it

Get step-by-step solutions from verified subject matter experts