

Question: I need asap w UULIT LIVE . Assignment 3 B Assignment Due July 19 at 11:55 PM Ends Jul 19, 2020 11:55 PM Control Chart
I need asap
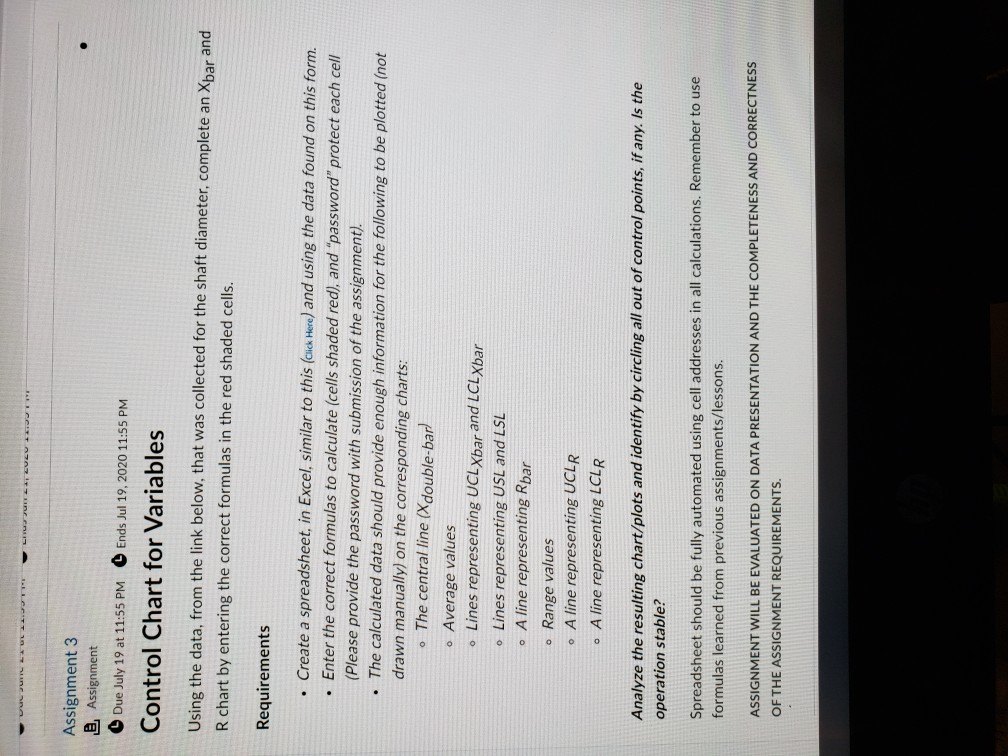
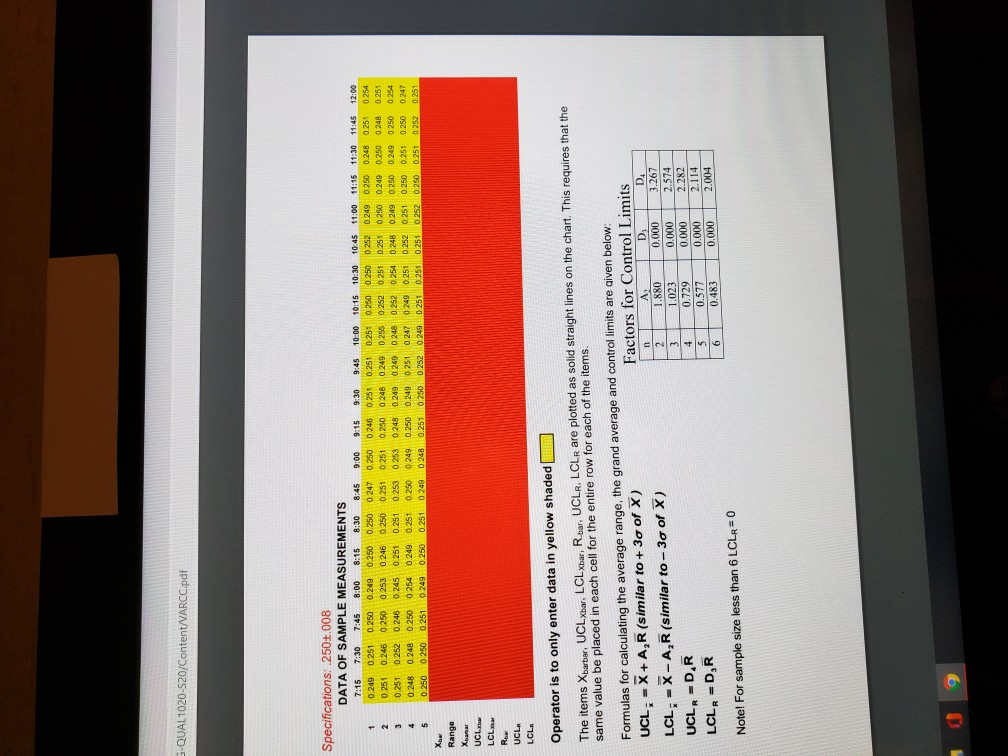
w UULIT LIVE . Assignment 3 B Assignment Due July 19 at 11:55 PM Ends Jul 19, 2020 11:55 PM Control Chart for Variables Using the data, from the link below, that was collected for the shaft diameter, complete an Xbar and R chart by entering the correct formulas in the red shaded cells. Requirements Create a spreadsheet, in Excel, similar to this (click Here) and using the data found on this form. Enter the correct formulas to calculate (cells shaded red), and "password" protect each cell (Please provide the password with submission of the assignment). The calculated data should provide enough information for the following to be plotted (not drawn manually) on the corresponding charts: The central line (Xdouble-bar) Average values Lines representing UCLXbar and LCL Xbar Lines representing USL and LSL A line representing Rbar Range values A line representing UCLR A line representing LCLR Analyze the resulting chart/plots and identify by circling all out of control points, if any. Is the operation stable? Spreadsheet should be fully automated using cell addresses in all calculations. Remember to use formulas learned from previous assignments/lessons. ASSIGNMENT WILL BE EVALUATED ON DATA PRESENTATION AND THE COMPLETENESS AND CORRECTNESS OF THE ASSIGNMENT REQUIREMENTS. G-QUAL 1020-520/Content/VARCC.pdf Specifications: 250:.008 DATA OF SAMPLE MEASUREMENTS 7:15 7:30 7:46 8:00 8:15 8:30 8:45 9:00 9:15 9:30 9:45 10:00 1 0.249 0.251 0.250 0.249 0.250 0.250 0.247 0.250 0.246 0.251 0.251 0.251 2 0 251 0.246 0250 0.253 0.246 0.250 0.251 0.251 0.250 0.248 0.249 0.255 3 0.251 0.252 0.246 0.245 0 251 0.251 0.253 0.253 0248 0249 0.249 0248 4 0248 0.248 0.250 0254 0.249 0.251 0.250 0 249 0.250 0.249 0251 0.247 5 0.250 0 250 0.251 0 249 0.250 0.251 0 249 0.24 0.250 250 0.252 0249 be Range 10:15 10:30 0:45 11:00 11:15 11:30 11:45 12:00 0.250 0.250 0252 0.249 0.250 0.248 0.251 0254 0.252 0.251 0.251 250 0.249 0.250 0248 0.251 0.252 0254 0 248 0249 0.250 0.249 0.250 0.254 0 249 0.251 0 2520 251 0.250 0.250 0.250 0.247 0251 0251 251 252 0.250 0.251 0252 0.251 UCL LCLOM Row UCL. LCLR Operator is to only enter data in yellow shaded The items Xbarbar. UCL Xhar. LCL xbar, R.bar, UCLR. LCLR are plotted as solid straight lines on the chart. This requires that the same value be placed in each cell for the entire row for each of the items. Formulas for calculating the average range, the grand average and control limits are given below: UCL, - X+A, R (similar to +30 of X) Factors for Control Limits D4 As LCL: = X-A, R (similar to -30 of X) 2 880 0.000 .267 UCLR - DR 1.023 0.000 2.574 0.729 2.282 LCLR - DR 0.000 2.114 6 0.483 0.000 2.004 Note! For sample size less than 6 LCLR=0 n D 6 0.000 + 5 0.577 9Step by Step Solution
There are 3 Steps involved in it
1 Expert Approved Answer
Step: 1 Unlock

Question Has Been Solved by an Expert!
Get step-by-step solutions from verified subject matter experts
Step: 2 Unlock
Step: 3 Unlock