

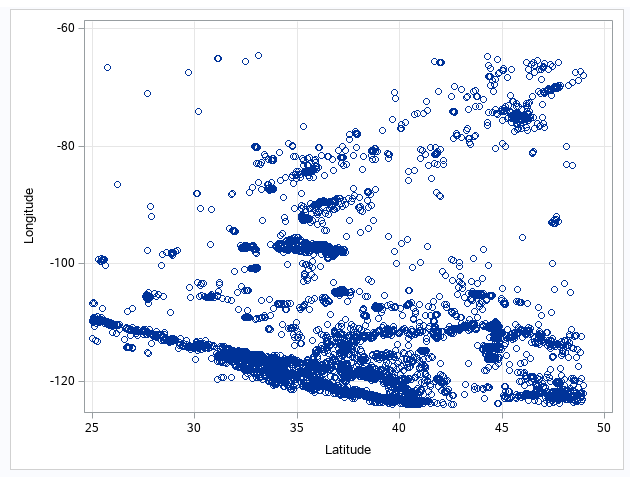
Question: I need assistance determining if the variables selected within this cluster analysis (longitude & latitude) are viable candidates to use in cluster analysis. See below
I need assistance determining if the variables selected within this cluster analysis (longitude & latitude) are viable candidates to use in cluster analysis. See below aalysis from SAS Cluster Variables procedure.
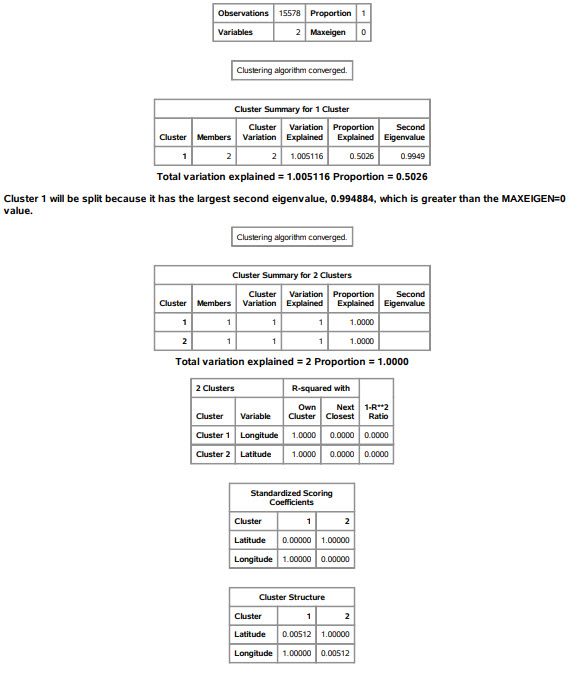
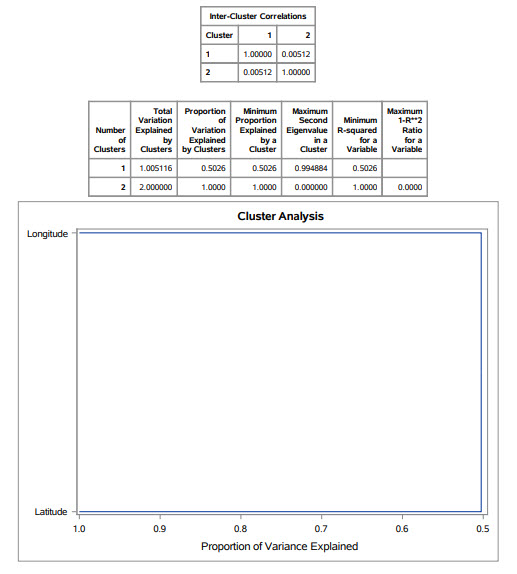
\fObservations 15578 Proportion 1 Variables 2 Maxeigen Clustering algorithm converged. Cluster Summary for 1 Cluster Cluster Variation Proportion Second Cluster Members Variation Explained Explained Eigenvalue 1.005116 0.5026 0.9949 Total variation explained = 1.005116 Proportion = 0.5026 Cluster 1 will be split because it has the largest second eigenvalue, 0.994884, which is greater than the MAXEIGEN=0 value. Clustering algorithm converged. Cluster Summary for 2 Clusters Cluster Variation Proportion Second Cluster Members Variation Explained Explained Eigenvalue 1.0000 1.0000 Total variation explained = 2 Proportion = 1.0000 2 Clusters R-squared with Own Next 1-R#2 Cluster Variable Cluster Closest Ratio Cluster 1 Longitude 1.0000 0.0000 0.0000 Cluster 2 Latitude 1.0000 0.0000 1.0000 Standardized Scoring Coefficients Cluster 2 Latitude 0. 00000 1.00000 Longitude 1.00000 0.00000 Cluster Structure Cluster Latitude 0.00512 1.00000 Longitude 1.00000 0.00512Inter-Cluster Correlations Cluster 2 1.00000 0.00512 2 100512 1.10060 Total Proportion Minimum Maximum Maximum Variation of Proportion Second Minimum 1-R*2 Number Explained Variation Explained Eigenvalue R-squared Patio D by Explained by 2 in a for a Clusters Clusters by Clusters Cluster Cluster Variable Variable 1.005116 0.5026 15026 0.994084 0.5026 2 2.000000 1.0000 1.0000 1.0000 0.0000 Cluster Analysis Longitude Latitude 1.0 0.9 0.8 0.7 0.6 0.5 Proportion of Variance Explained
Step by Step Solution
There are 3 Steps involved in it

Get step-by-step solutions from verified subject matter experts