

Question: I need assistance with the Vertical Analysis Ratio chart below for Ford Motor Co. for year 2018? Please assist if possible Numbers below are reported
I need assistance with the Vertical Analysis Ratio chart below for Ford Motor Co. for year 2018? Please assist if possible
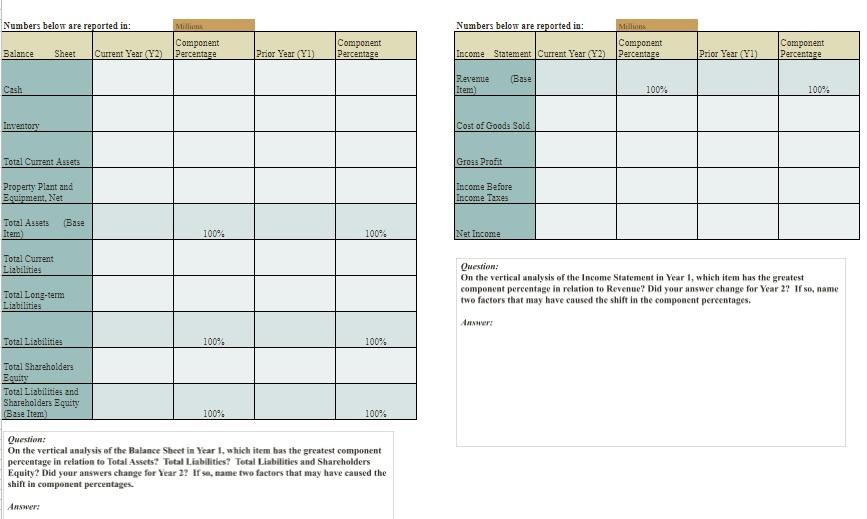
Numbers below are reported in: Mills Component Percentage Numbers below are reported in: Millions Component income Statement Current Year (Y2) Percentage Balance Sheet Component Percentage Current Year (Y2) Prior Year (71) Component Percentage Prior Year (Yl) (Base Cash Revenue Item) 100% 100% Inventory Cost of Good, Sold Total Current Assets Gross Profit Property Plant and Bouinment Net Income Before Income Taxes (Base Total Assets Item) 100% 100% Net Income Total Current Liabilities Total Long-term Liabilities Question: On the vertical analysis of the Income Statement in Year 1, which item has the greatest component percentage in relation to Revenue? Did your answer change for Year 2? If so, name two factors that may have caused the shift in the component percentages. Answer: Total Liabilities 100% 100% Total Shareholders Equity Total Liabilities and Shareholders Equity (Base Item 100% 100% Question: On the vertical analysis of the Balance Sheet in Year I, which item has the greatest component percentage in relation to Total Assets? Tutal Liabilities? Total Liabilities and Shareholders Equity? Did your answers change for Year 2? If so, name two factors that may have caused the shift in component percentages. Answer: Numbers below are reported in: Mills Component Percentage Numbers below are reported in: Millions Component income Statement Current Year (Y2) Percentage Balance Sheet Component Percentage Current Year (Y2) Prior Year (71) Component Percentage Prior Year (Yl) (Base Cash Revenue Item) 100% 100% Inventory Cost of Good, Sold Total Current Assets Gross Profit Property Plant and Bouinment Net Income Before Income Taxes (Base Total Assets Item) 100% 100% Net Income Total Current Liabilities Total Long-term Liabilities Question: On the vertical analysis of the Income Statement in Year 1, which item has the greatest component percentage in relation to Revenue? Did your answer change for Year 2? If so, name two factors that may have caused the shift in the component percentages. Answer: Total Liabilities 100% 100% Total Shareholders Equity Total Liabilities and Shareholders Equity (Base Item 100% 100% Question: On the vertical analysis of the Balance Sheet in Year I, which item has the greatest component percentage in relation to Total Assets? Tutal Liabilities? Total Liabilities and Shareholders Equity? Did your answers change for Year 2? If so, name two factors that may have caused the shift in component percentages
Step by Step Solution
There are 3 Steps involved in it

Get step-by-step solutions from verified subject matter experts