

Question: I need detailed computation and solution for item No. 8 and 10 questions. Please use the Chi-square Test of independence Sample Computation for No. 9
I need detailed computation and solution for item No. 8 and 10 questions.
Please use the Chi-square Test of independence
Sample Computation for No. 9
is given already by my prof. With correction on Total number of college faculty members (107) instead of 110.
Thank you.
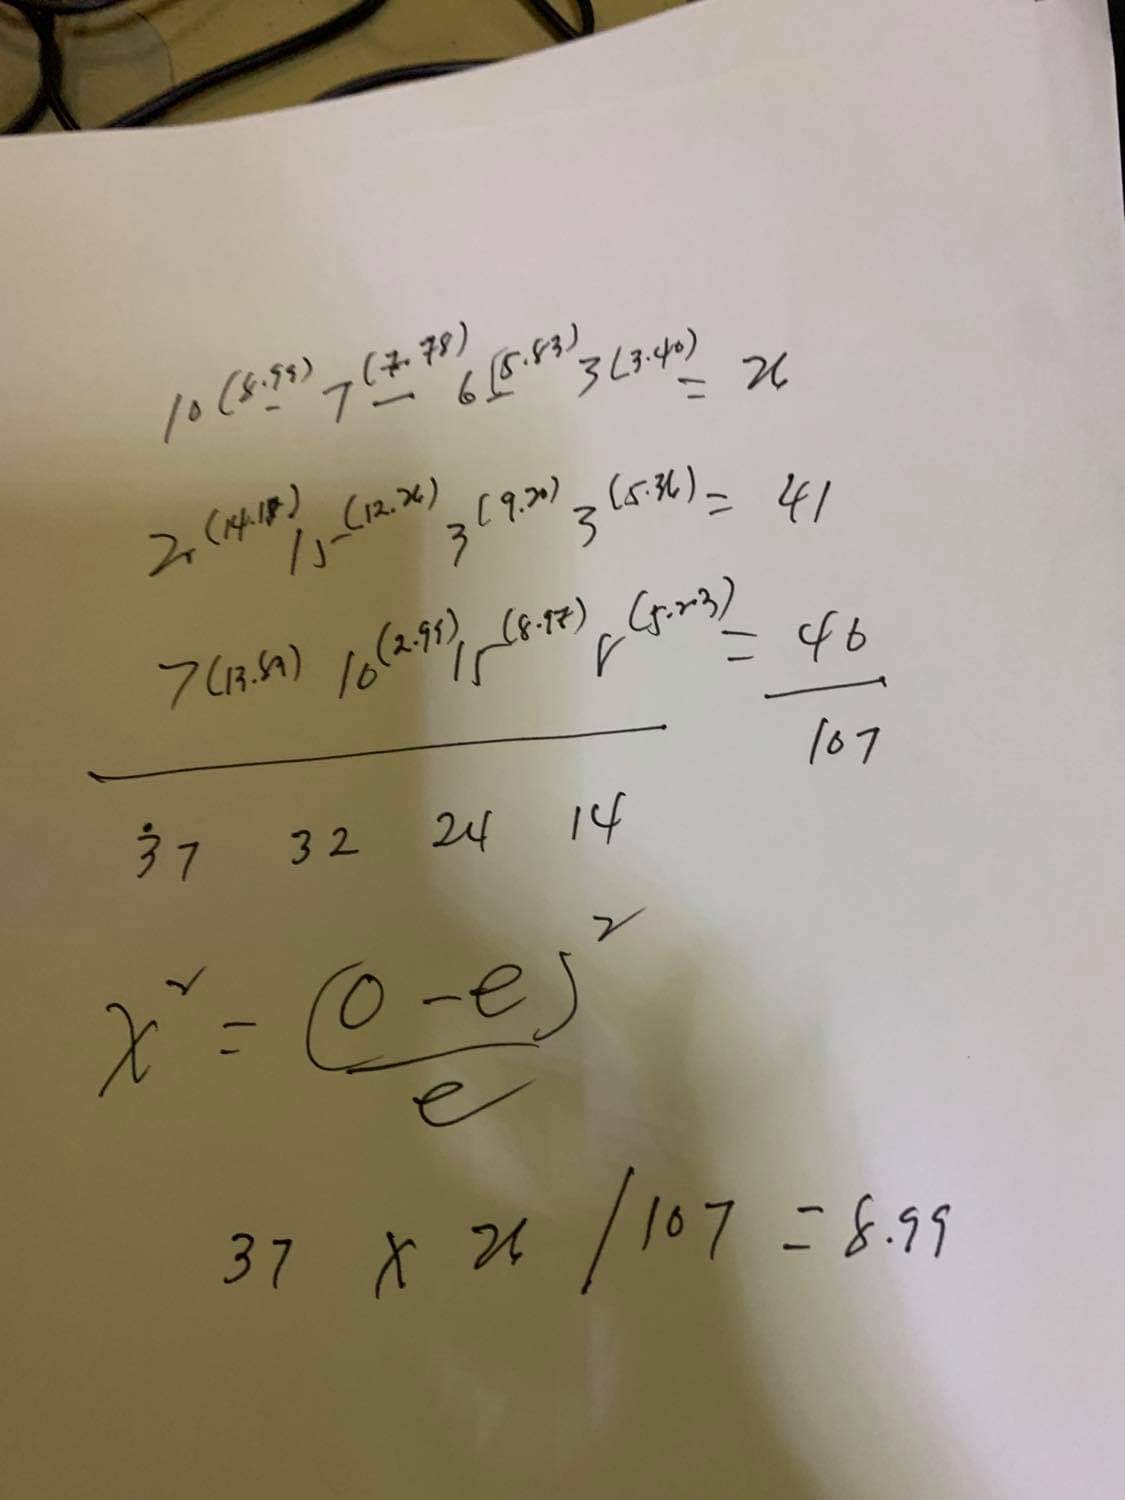
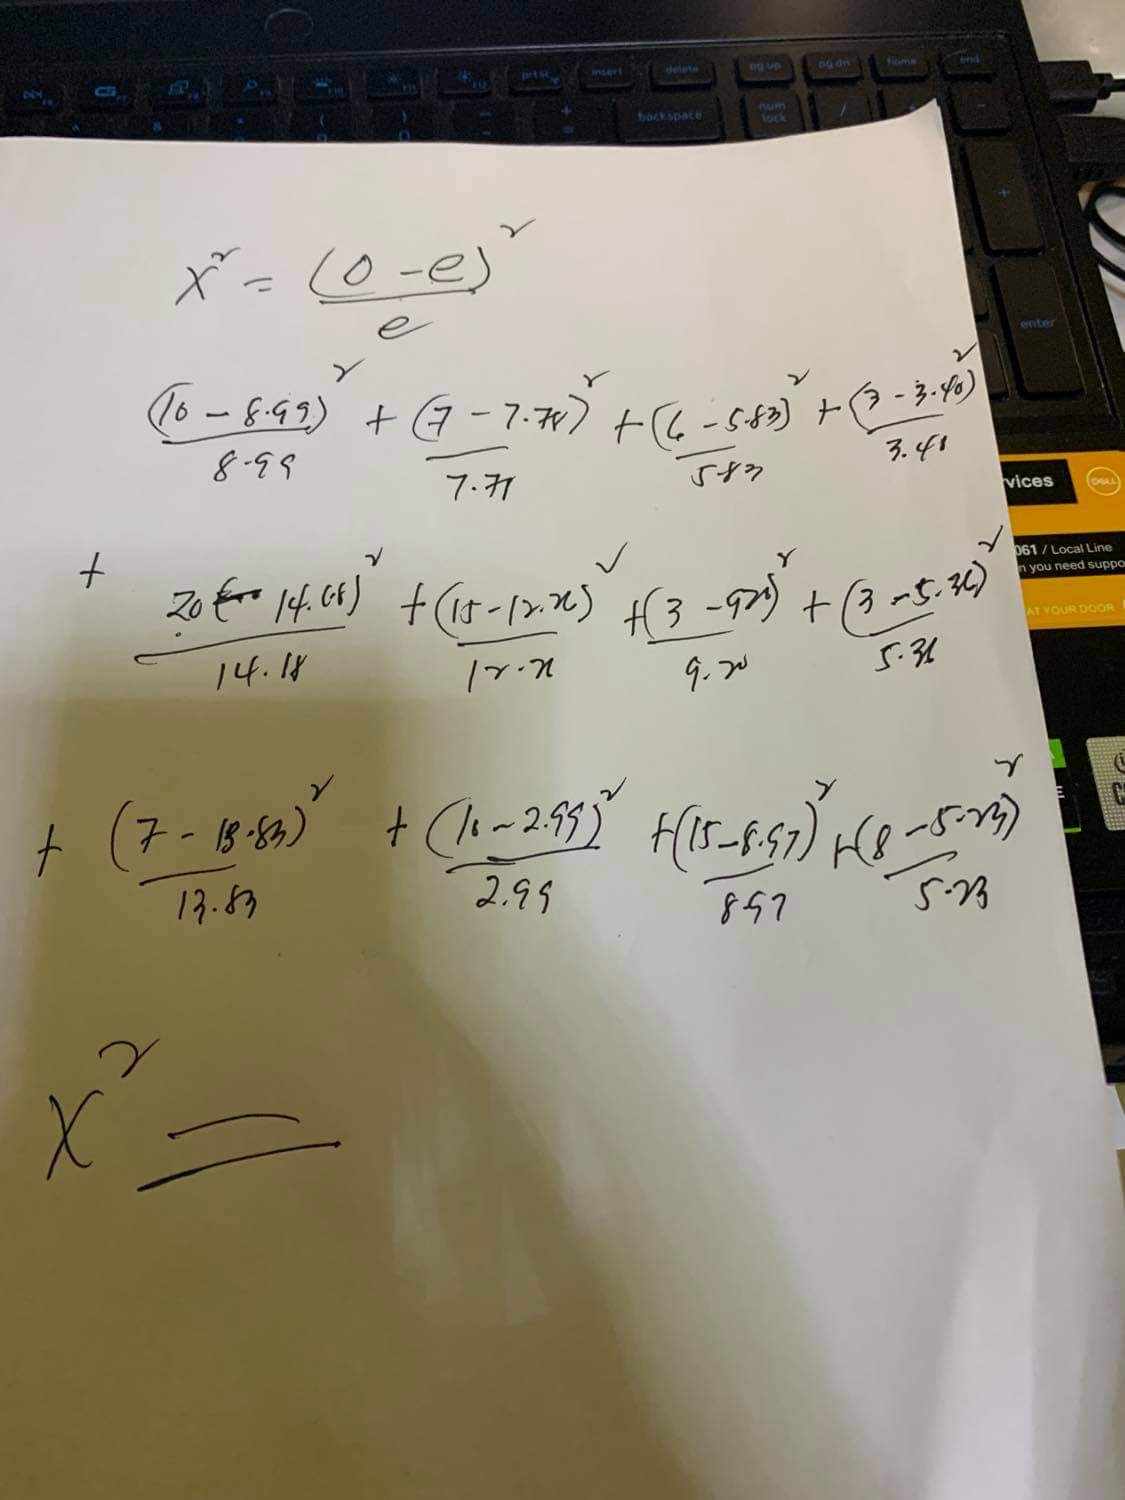
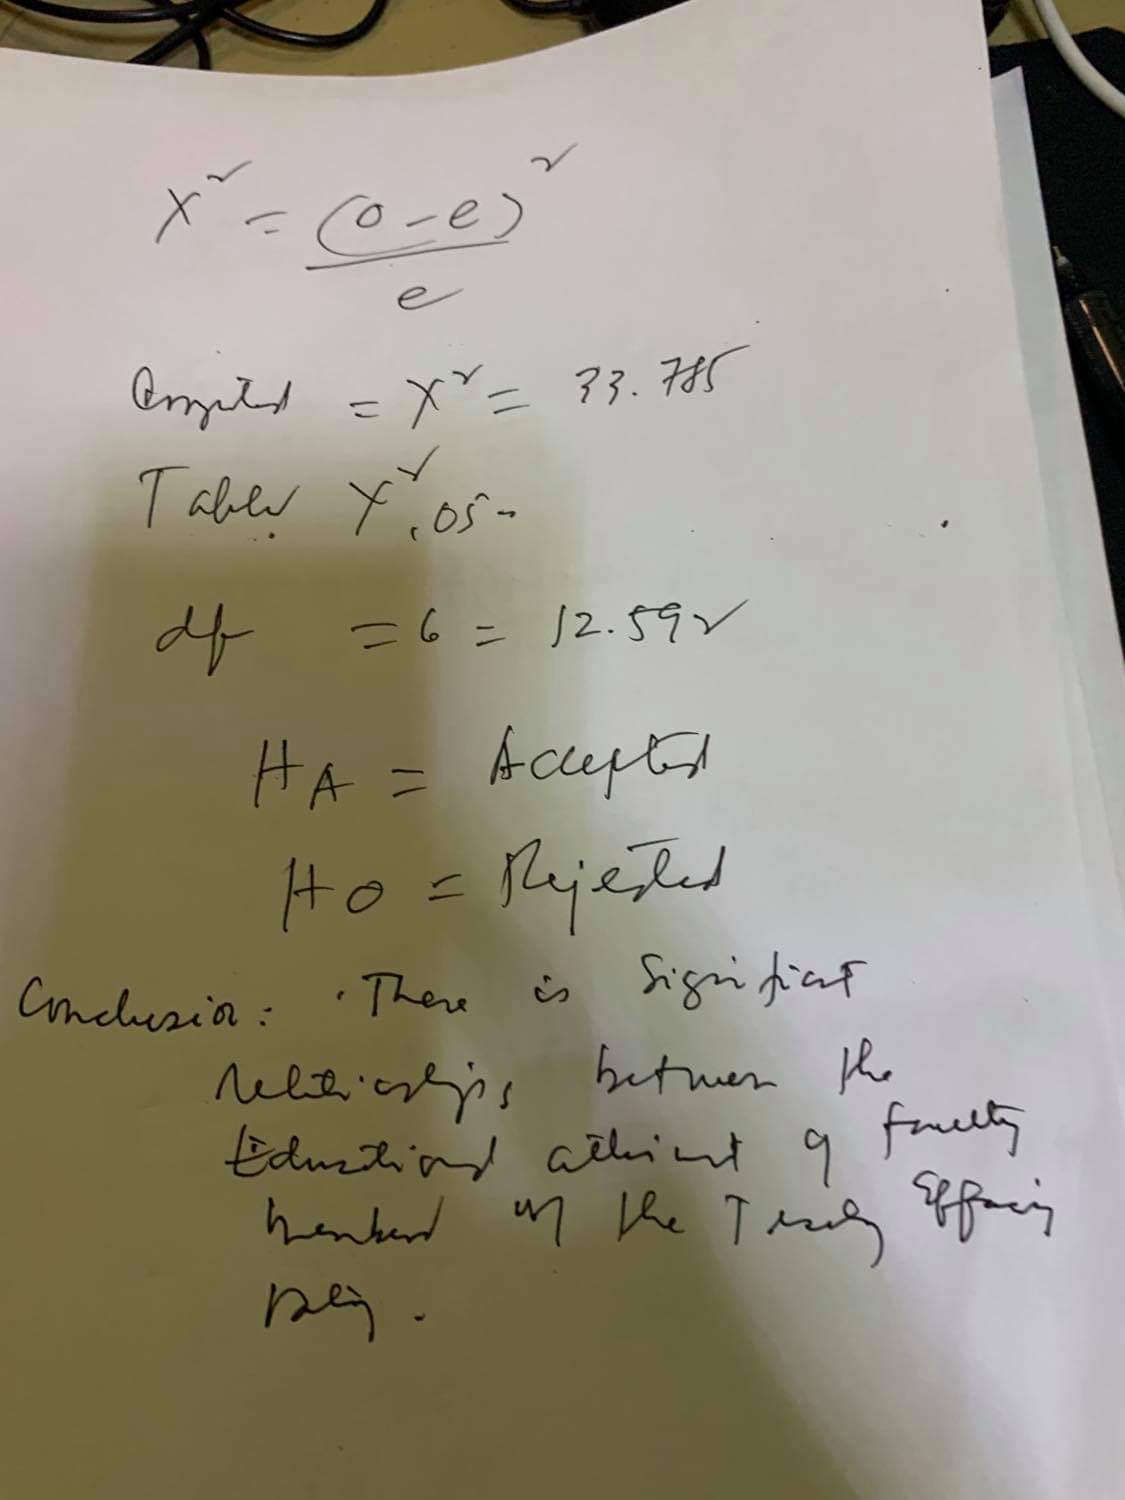
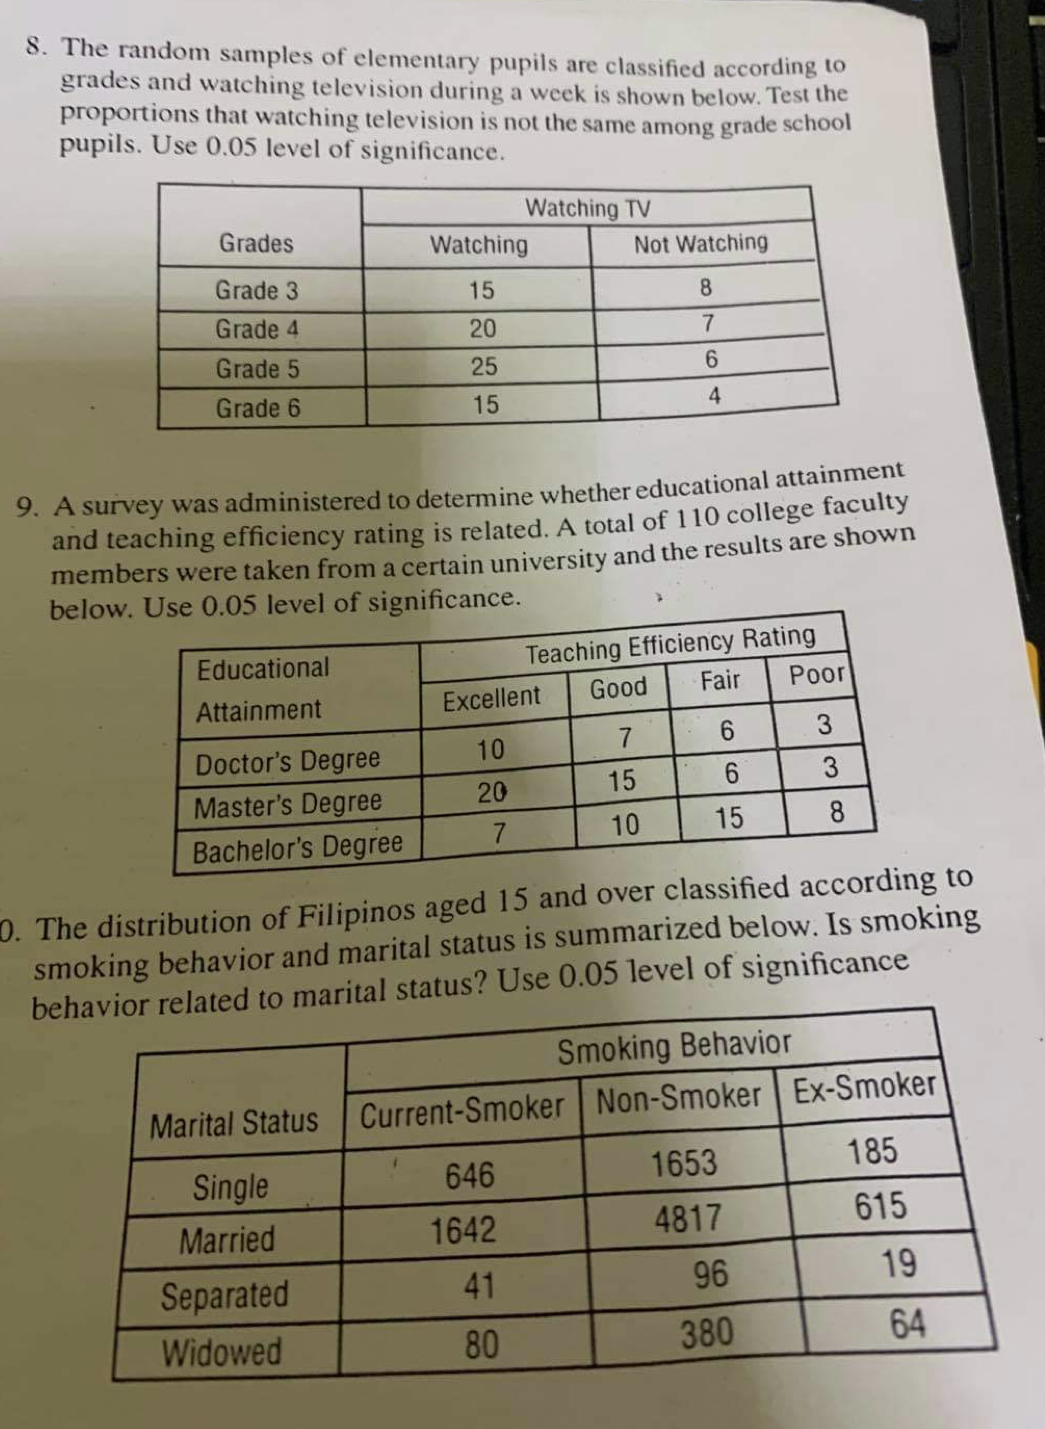
10 (5:98 ) ( 7 78 ) - 6 ( 5 . 53 ) " 3 (3.40 ) 2. (14.18 ) 1 1- ( 12.26 ) 3 ( 9.20 ) 3 ( 5. 36 ) = 41 7 ( 13.59 ) 10 (2. 95 ) (8.17 ) (5. 3 ) 37 32 24 14 107 X 1 0 - e ) e 37 x 26 / 107 - 8.99on Up backspace = ( 0 -e) enter (16 - 8.95) + (7 - 7. FF) + ( 6 - 5-83) + (7- 3.80) 7.71 3. 41 vices 20 14. GF ) 061 / Local Line + ( 15 - 12:24 ) + 3 - 921 you need suppo + (3 - 5.36) AT YOUR DOOR 14.18 5. 31 + (7- 18-83 ) + ( 10 - 2.95 ) +(15-8.97 ) H(8 - 5-23) 13.83 2.95 8572 o - e ) e Emily = XY = 33.785 = 6 = 12.59 V HA = Accepted Ho = Misled Conclusion: There is significant nelhargis betwen the nagg.8. The random samples of elementary pupils are classified according to grades and watching television during a week is shown below. Test the proportions that watching television is not the same among grade school pupils. Use 0.05 level of significance. Watching TV Grades Watching Not Watching Grade 3 15 8 Grade 4 20 7 Grade 5 25 6 Grade 6 15 4 9. A survey was administered to determine whether educational attainment and teaching efficiency rating is related. A total of 110 college faculty members were taken from a certain university and the results are shown below. Use 0.05 level of significance. Educational Teaching Efficiency Rating Attainment Excellent Good Fair Poor Doctor's Degree 10 7 6 3 Master's Degree 20 15 6 3 Bachelor's Degree 7 10 15 8 0. The distribution of Filipinos aged 15 and over classified according to smoking behavior and marital status is summarized below. Is smoking behavior related to marital status? Use 0.05 level of significance Smoking Behavior Marital Status Current-Smoker Non-Smoker Ex-Smoker Single 646 1653 185 Married 1642 4817 615 Separated 41 96 19 Widowed 80 380 64
Step by Step Solution
There are 3 Steps involved in it

Get step-by-step solutions from verified subject matter experts