

Question: I need each example plot below answered if its 1.)appropriate, 2.) not appropriate, fails constant variance assumption, or 3.) not appropriate, fails mean of zero
I need each example plot below answered if its 1.)appropriate, 2.) not appropriate, fails constant variance assumption, or 3.) not appropriate, fails mean of zero assumption.
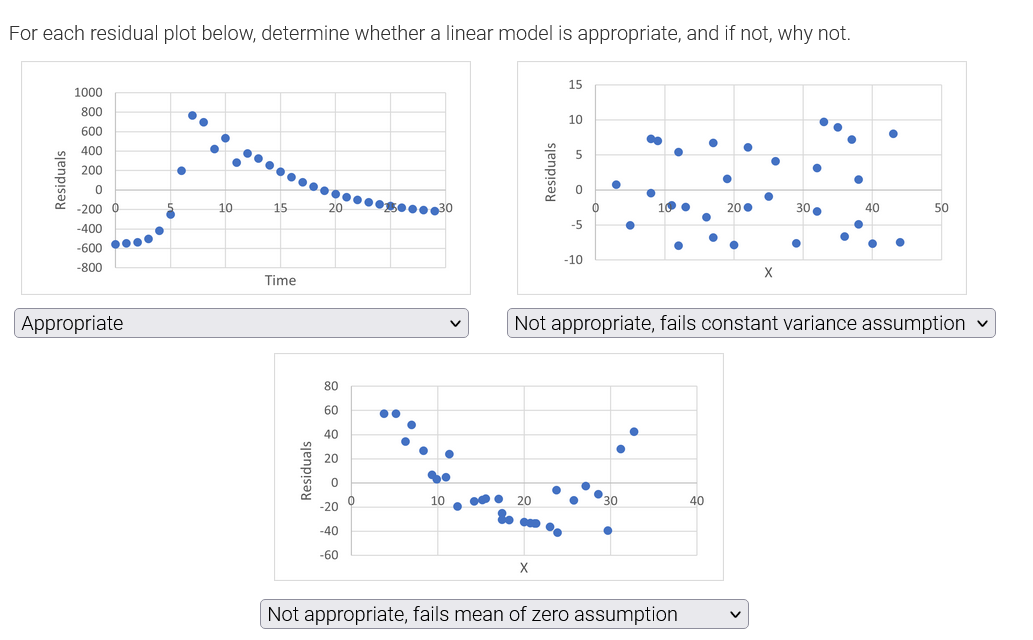
For each residual plot below, determine whether a linear model is appropriate, and if not, why not. 15 1000 800 10 600 400 un 200 Residuals Residuals 0 -200 10 15 20 100 20 0 30 40 50 -400 -5 -600 .... -800 -10 Time X Appropriate Not appropriate, fails constant variance assumption 80 60 40 20 Residuals -20 10 . . 20 30 40 -40 -60 X Not appropriate, fails mean of zero assumption V
Step by Step Solution
There are 3 Steps involved in it
1 Expert Approved Answer
Step: 1 Unlock

Question Has Been Solved by an Expert!
Get step-by-step solutions from verified subject matter experts
Step: 2 Unlock
Step: 3 Unlock