

Question: I need Excel formulas as well. U U 20% 1) The following table contains the covariance matrix for five assets. The mean returns are also
I need Excel formulas as well. 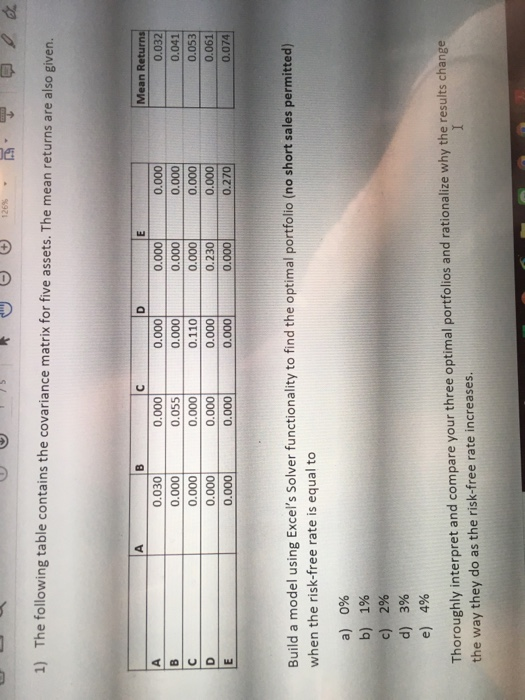
U U 20% 1) The following table contains the covariance matrix for five assets. The mean returns are also given. 0.030 0.000 0.000 0.000 0.000 0.000 0.055 0.000 0.000 0.000 0.000 0.000 0.110 0.000 0.000 0.000 0.000 0.000 0.230 0.000 0.000 0.000 0.000 0.000 0.270 Mean Returns 0.032 0.041 0.053 0.061 0.074 Build a model using Excel's Solver functionality to find the optimal portfolio (no short sales permitted) when the risk-free rate is equal to a) 0% b) 1% c) 2% d) 3% e) 4% Thoroughly interpret and compare your three optimal portfolios and rationalize why the results change the way they do as the risk-free rate increases. U U 20% 1) The following table contains the covariance matrix for five assets. The mean returns are also given. 0.030 0.000 0.000 0.000 0.000 0.000 0.055 0.000 0.000 0.000 0.000 0.000 0.110 0.000 0.000 0.000 0.000 0.000 0.230 0.000 0.000 0.000 0.000 0.000 0.270 Mean Returns 0.032 0.041 0.053 0.061 0.074 Build a model using Excel's Solver functionality to find the optimal portfolio (no short sales permitted) when the risk-free rate is equal to a) 0% b) 1% c) 2% d) 3% e) 4% Thoroughly interpret and compare your three optimal portfolios and rationalize why the results change the way they do as the risk-free rate increases
Step by Step Solution
There are 3 Steps involved in it

Get step-by-step solutions from verified subject matter experts