

Question: I need explanation for the correct answer and the steps as well. In an experiment about the behavior of adults, each of the 50 subjects
I need explanation for the correct answer and the steps as well.
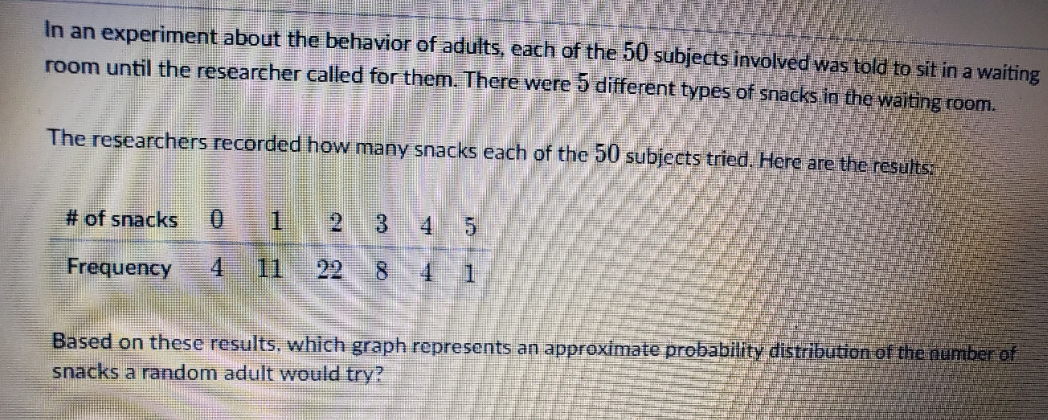
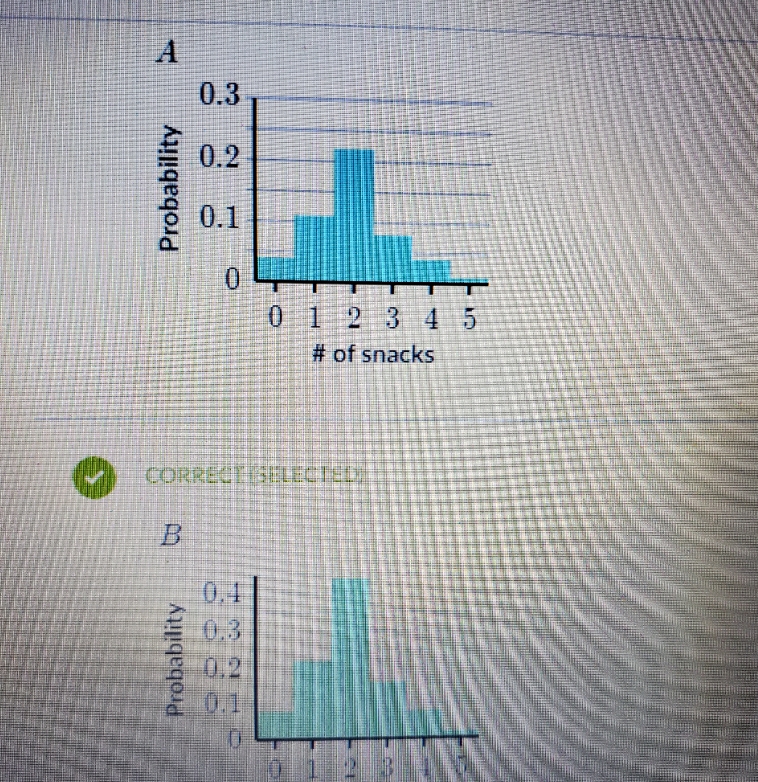
In an experiment about the behavior of adults, each of the 50 subjects involved was told to sit in a waiting room until the researcher called for them. There were 5 different types of snacks in the waiting room. The researchers recorded how many snacks each of the 50 subjects tried. Here are the results: # of snacks 2 3 5 Frequency 1 11 22 8 4 1 Based on these results, which graph represents an approximate probability distribution of the number of snacks a random adult would try?A 0.3 Probability 0.1 0 012345 # of snacks CORRECTSELECTED B 0.4 Probability
Step by Step Solution
There are 3 Steps involved in it
1 Expert Approved Answer
Step: 1 Unlock

Question Has Been Solved by an Expert!
Get step-by-step solutions from verified subject matter experts
Step: 2 Unlock
Step: 3 Unlock