

Question: I need handwritten please dfast understand please The double box-plot below depicts the weekly working hours of 2 groups of employees. Dataset A 13 20
I need handwritten please dfast understand please
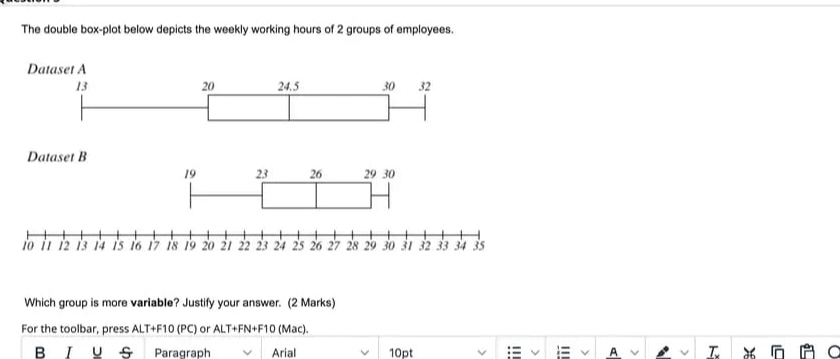
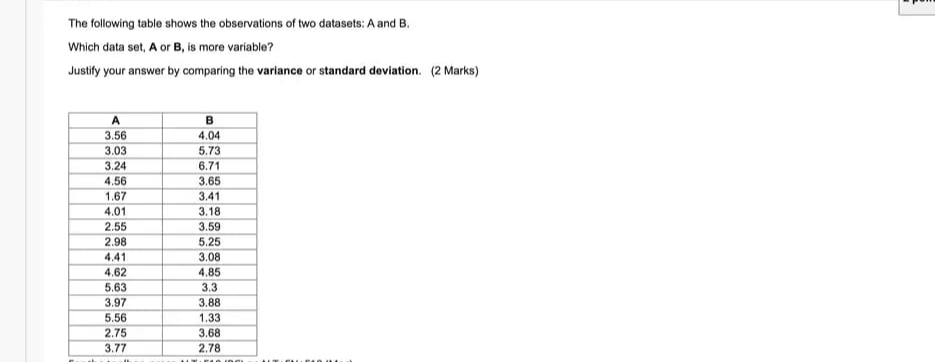
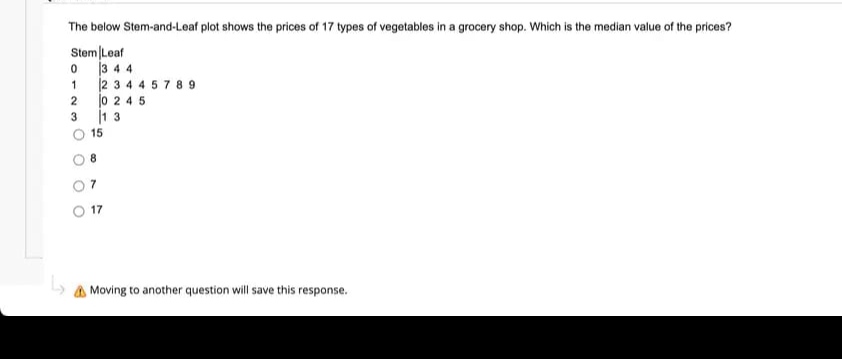
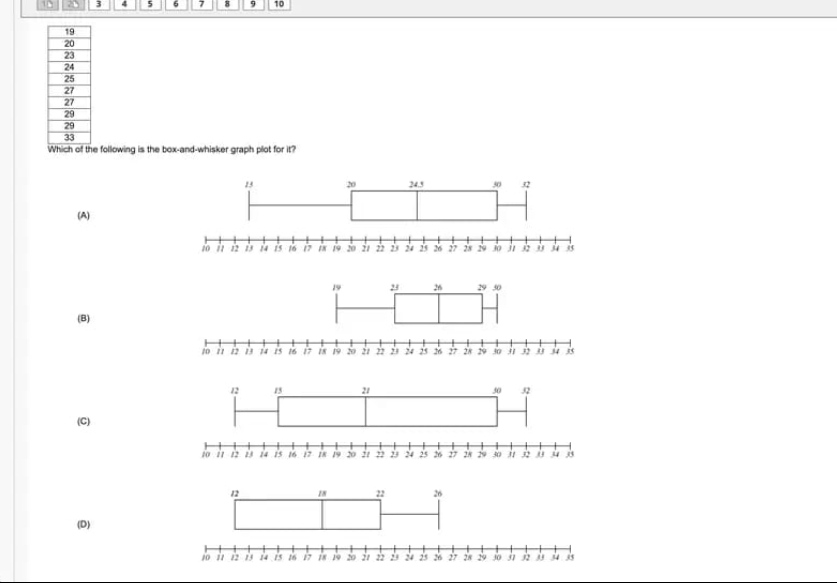
The double box-plot below depicts the weekly working hours of 2 groups of employees. Dataset A 13 20 24.5 30 32 Dataset B 19 23 26 29 30 10 11 12 13 Which group is more variable? Justify your answer. (2 Marks) For the toolbar, press ALT+F10 (PC) or ALT+FN+F10 (Mac). BI US Paragraph Arial 10pt V EVEVAV v TY GAOThe following table shows the observations of two datasets: A and B. Which data set, A or B, is more variable? Justify your answer by comparing the variance or standard deviation. (2 Marks) A B 3.56 4.04 3.03 5.73 3.24 6.71 4.56 3.65 1.67 3.41 4.01 3.18 2.55 3.59 2.98 5.25 4.41 3.08 4.62 4.85 5.63 3.3 3.97 3.88 5.56 1.33 2.75 3.68 3.77 2.78The below Stem-and-Leaf plot shows the prices of 17 types of vegetables in a grocery shop. Which is the median value of the prices? Stem Leaf 0 34 4 1 23 4 4 5 7 8 9 2 0 2 4 5 3 1 3 O 15 OB O7 O 17 Ly Moving to another question will save this response.10 19 20 23 24 25 Which of the following is the box-and-whisker graph plot for it? (A) 29 30 (B) (C) (D)
Step by Step Solution
There are 3 Steps involved in it

Get step-by-step solutions from verified subject matter experts